How to Measure Product Usage in 2024 (+Metrics)
- August 10, 2022


How a customer uses a product influences every aspect of a business. Product usage is at the heart of every significant decision, from how a tool is designed to what pitches the sales team uses.
But many companies make the mistake of guessing how their product is used. They make assumptions about how users interact with the product, how it supports their day-to-day activities, and what they like most (or least) about it. And unfortunately, many times, those assumptions are flat-out wrong.
When you use assumptions or guesses to make product decisions, you create something your audience feels disconnected from or doesn’t enjoy using.
If resistance is high enough, they’ll switch to a competitor and churn. Failing to gain insights from your audience on what they want from your product could leave the door open for a competitor to come in and steal your user base.
To start making better decisions, you must invest in a product analytics strategy that empowers teams to analyze product usage.
What Is Product Usage Analytics?
Product usage analytics looks at how your users interact with your product. It shares insights including:
- The levels of engagement for features across different segments of users.
- The most common user journeys and paths.
- How often are users engaging with your product? Daily, weekly, monthly?
- The location, device, and time your user engaged with the product.
- How sticky your product is and overall user adoption level.
- The effective of your in-app experiences like onboarding and new feature launches are.
We’ll take a closer look at what you can learn from each of these metrics later on, but for now, consider this example.
Let’s say your product is a CRM. Product usage analytics would give insights into how frequently your user’s access information stored in the CRM, how many users are working from mobile devices, and what features your users find most useful. With that information, you can make strategic business decisions like optimizing your mobile app for a better on-the-go experience or creating a quick-access look at crucial CRM data.
You might land on those decisions naturally, but with data backing your choices, you can create or optimize your product so it aligns with your audience’s needs.
Benefits of Tracking Product Usage
The biggest benefit of tracking product usage is that it eliminates guesswork so you can make better decisions. Making data-driven product decisions can lead to:
1. Better products
Understanding how your product is used helps product teams build better, more useful products. This leads to more streamlined products with fewer friction points – all by using data to make informed product decisions.
2. Happier long-term customers
When your products are created with your end user, they’re more likely to be satisfied with updates, changes, and features. They’re more likely to continue using a project that genuinely meets their needs — and might even recommend it to friends, family, or colleagues looking for a similar product.
3. Fewer wasted resources
When you’re just guessing what your audience wants, there is a high probability that changes to your product won’t land as you hoped. You might invest in introducing a new product feature that audiences don’t want, or you might roll out a new product design that makes using your product more difficult. In the end, you’ve wasted money — and you’ll need to invest more to solve the issues you’ve created.
4. Increased revenue
Better product decisions can reduce wasted time, increase retention rates, and reduce employee turnover, all contributing to increased revenue and saved money. Using product usage data to improve your decision-making, you can start seeing more investment returns.
5. More engaged team members and employees
Needing to double up on work to solve issues or make additional changes is frustrating and annoying. When you’re using data to drive your product decisions, employees can feel more satisfied with their work and will have to deal with fewer hurdles down the road.
Analyze user behavior and track product usage with Whatfix Analytics
Enable your product managers to easily track and analyze user behavior and product usage with Whatfix Analytics, a no-code event tracking solution. With Whatfix Analytics, capture all user actions without engineering support, understand product usage, identify dropoff areas, understand feature adoption, map user journeys, build user cohorts, and make data-driven product decisions.
Important Product Usage Metrics to Measure
As with any data, getting the desired results depends on measuring the appropriate metrics. Here are the most important product usage metrics to measure:
1. Usage frequency
Usage frequency tells you how often an individual uses your product. It’s an at-a-glance metric that helps you better understand if your product is a daily, weekly, monthly, or beyond the necessity for your users.
To find usage frequency, simply set the desired time period and count the number of times a user engages with your platform.
2. Time-to-value
Time-to-value is the amount of time it takes for a customer to achieve a perceived level of value from your product — sometimes referred to as the “aha” moment. Value is realized when the user achieves the desired outcome from the product and should be kept low to improve retention and reduce churn.
To measure time-to-value, you need to identify what “value” is for your users or the benefit they want to receive from your product. The value you set should be measurable. Then, measure the time between a user’s use of your product and when they reached your predetermined value level.
3. Time spent using the product
Similar to usage frequency, time spent using the product is a high-level metric that tells you how much time a user spends using your product. Ideally, your users would use your product frequently and spend significant time with it.
You’ll want to measure each user session to find the time spent using the product. Set a specific time frame to measure, such as a day or week, and measure the total amount of time a user spends with your product.
4. Product and feature adoption
Product adoption tell you how many new users have become active or engaged users of your product. To find your product adoption rate, divide the number of new engaged users by the total number of new signups.
Feature adoption is similar, but it looks specifically at what features have been adopted. To find your feature adoption rate, divide the number of users of a specific feature by the total number of users.
5. Bug reporting
Finding and fixing bugs in your product can ensure you’re delivering a high-quality product that users are happy to use. Measuring bug reporting helps you keep an eye on what bugs are popping up and how efficiently they’re being resolved.
You can consider several specific bug reporting metrics, including the number of bugs reported, the total number of bugs fixed, the number of new bugs reported, and bugs resolved.
6. Customer retention rate
For your product to grow, you need to retain customers. Your customer retention rate tells you the percentage of customers using your product.
To find your customer retention rate, divide the number of existing users you have at the end of a time period compared to the number of users you had at the start of that time period. Be sure not to count any new users added during this time period in your count.
7. Churn rate
Churn rate is the opposite of customer retention rate. It tells you the number of users that have stopped using your product in a specific time period. Unlike customer retention rate, you want to keep your churn rate as low as possible.
To find your churn rate, Divide the number of customers you lost in a specific period by the number of customers you started with during that same period. As with customer retention rate, you don’t want to include any new users in your count. Furthermore, you can execute a retention analysis to uncover why customers are churning.
8. Free-to-paid conversions
If you offer a free product option, measuring your free-to-paid conversion rate can help you identify how many of your users find enough value in your product to upgrade their membership to a paid plan. Measuring free-to-paid conversions can help you better understand how many free users you need to onboard to continue to grow your paid memberships.
Free-to-paid conversions can also provide insights into what features or upgrades your users find valuable enough to pay for. This can help you make smarter decisions about pricing and product offerings.
How to Use Product Usage Data
Now that you have your product usage data, here are ways to use your new insights to uplevel your product and business.
1. Identify overall product trends
Use your product usage data to keep a pulse on your product’s use — including how, when, and where. When you notice how users frequently engage with your product, you can refine your features or tools to better address their needs.
Maintaining ongoing tracking of product trends can also help you predict future outcomes. You might find that your product is used more during specific periods of the year or times of the day. You can refine your sales, marketing, and product strategy with that information to better connect with your audiences.
2. Identify friction or pain points in your product
Just as you want to keep an eye on how your product is being used, you want to identify how it isn’t. What features aren’t being utilized to their full potential? Where are users getting stuck or confused when using your product?
With product usage metrics, you can find the weak points of your product so you can work to improve or eliminate them.
3. Improve overall product experience
A better product experience leads to a better customer experience. With insights into what your users like and don’t like about your product, you can refine it to meet their needs and preferences, making the entire experience more intuitive.
Measuring product usage insights can be as generic or specific as you need. Figure out how each group of users is engaging with your product so you can make changes just for them, to help improve your product stickiness for each cohort of users.
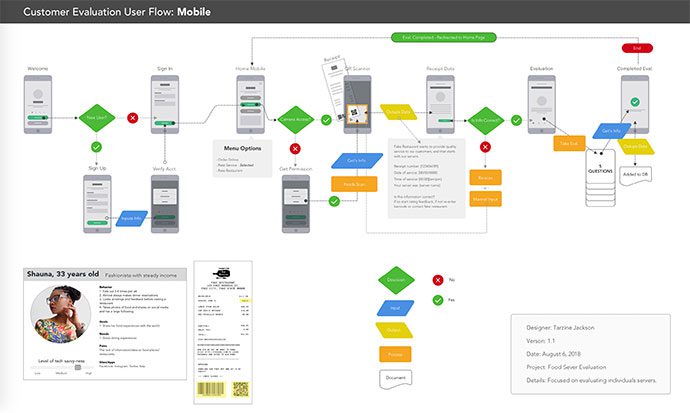
4. Create different product flows based on customer personas
Different segments of users will use your product differently. If you’re trying to appeal to everyone with a generic product flow, your users might not be as engaged as they could be.
Using analytics, you can break down the needs and preferences of each customer persona to create a unique user flow that aligns with how they use your product. You can further improve your relationship when you can accommodate all your users in a way that suits them best – allowing you to design a more tailored onboarding UX for each persona.
5. Convert more users into paid accounts
Getting new free users is a significant first step, but to scale, you need to convert them into paying customers. With product analytics, you can know how your free users engage with your platform, what features they value, and what additional benefits they’re willing to pay for.
You can also use your analytics in marketing and sales conversations to create more targeted strategies that help users understand the total value of your paid product.
6. Understand product and feature adoption
Investing in creating and rolling out new features or products is time-consuming and expensive. If you’re going to put the work in, you want to be sure your audience is appropriately using them.
Product usage metrics can show how users interact with specific features or areas of your product, so you know what they find helpful (and what they don’t). With this information, you can decide where to focus your energy or where to introduce new training or onboarding materials to bring your users up to speed.
7. Identify topics to write support content on
Sometimes, what users think is a bug is just user error. They might run into problems because they’re unsure of how to use your product or particular features, and they reach out to your support team for additional help (or, in the worst cases, they move on to a competitor).
When you know where your users struggle to learn how to use your product, you can create the support content they need to maximize your product value. Identifying the pain points or areas where audiences face problems will tell you where to focus your content efforts.
8. Gauge the success of your user onboarding
Proper onboarding is crucial for product success. If your user onboarding efforts fail to introduce your product and various features appropriately, audiences might believe the product isn’t right for them and sign up with a competitor instead.
With usage metrics, you can measure the success of your onboarding to see if you’re covering all your bases. You can identify gaps and work to improve your onboarding process to make sure they’re filled.
Product usage metrics provide the insights you need to successfully scale your business and create a product your audience genuinely loves. Stop wasting your time and resources guessing what your users are looking for and start making intelligent data-driven decisions that get you accurate results.
With a digital adoption platform (DAP) like Whatfix, product managers are empowered to build and analyze in-app experiences and content such as user onboarding, product tours, feature adoption, support, and more – all with no-code tools.
Learn more about Whatfix Analytics now!


Thank you for subscribing!