


When it’s time for employee performance reviews, managers are tasked with conducting an assessment of employee performance to guide them toward growth within the organization and ensure their teams are on track to reach goals and uphold company values.
Compiling a summary of an employee’s performance over the course of the year can be daunting. Which aspects of work are most important to consider? How can we eliminate biases and uncommon circumstances when comparing unique team members? Are there any mitigating factors?
Incorporating a graphic rating scale into the process is a great way to build consistency and structure into employee performance reviews in a way that ensures assessments are as objective, consistent, and straightforward as possible.
The graphic rating scale is a performance evaluation format used by managers and HR team members to measure employee performance and engagement. The individual completing the evaluation is presented with a question, statement, or category and is prompted to select from a set of possible answers representing how an employee’s performance matches up.
Graphic rating scales can be used in any business situation involving soliciting feedback, including post-training or project feedback, in addition to employee experience evaluations. For performance evaluations, specifically, graphic rating scales are often used to convey an employee’s performance or aptitude in a straightforward way that allows managers to separate employees into groups. These categories allow managers to prescribe the next steps for employees in those groups, including salary adjustments, promotions, and performance improvement plans.
Graphic rating scales can be used to measure employee behavior, sentiments, and aptitudes. Because these qualities vary across roles or areas of work, the prompts used in employee assessments may vary as well.
Some of the commonly measured behaviors are:
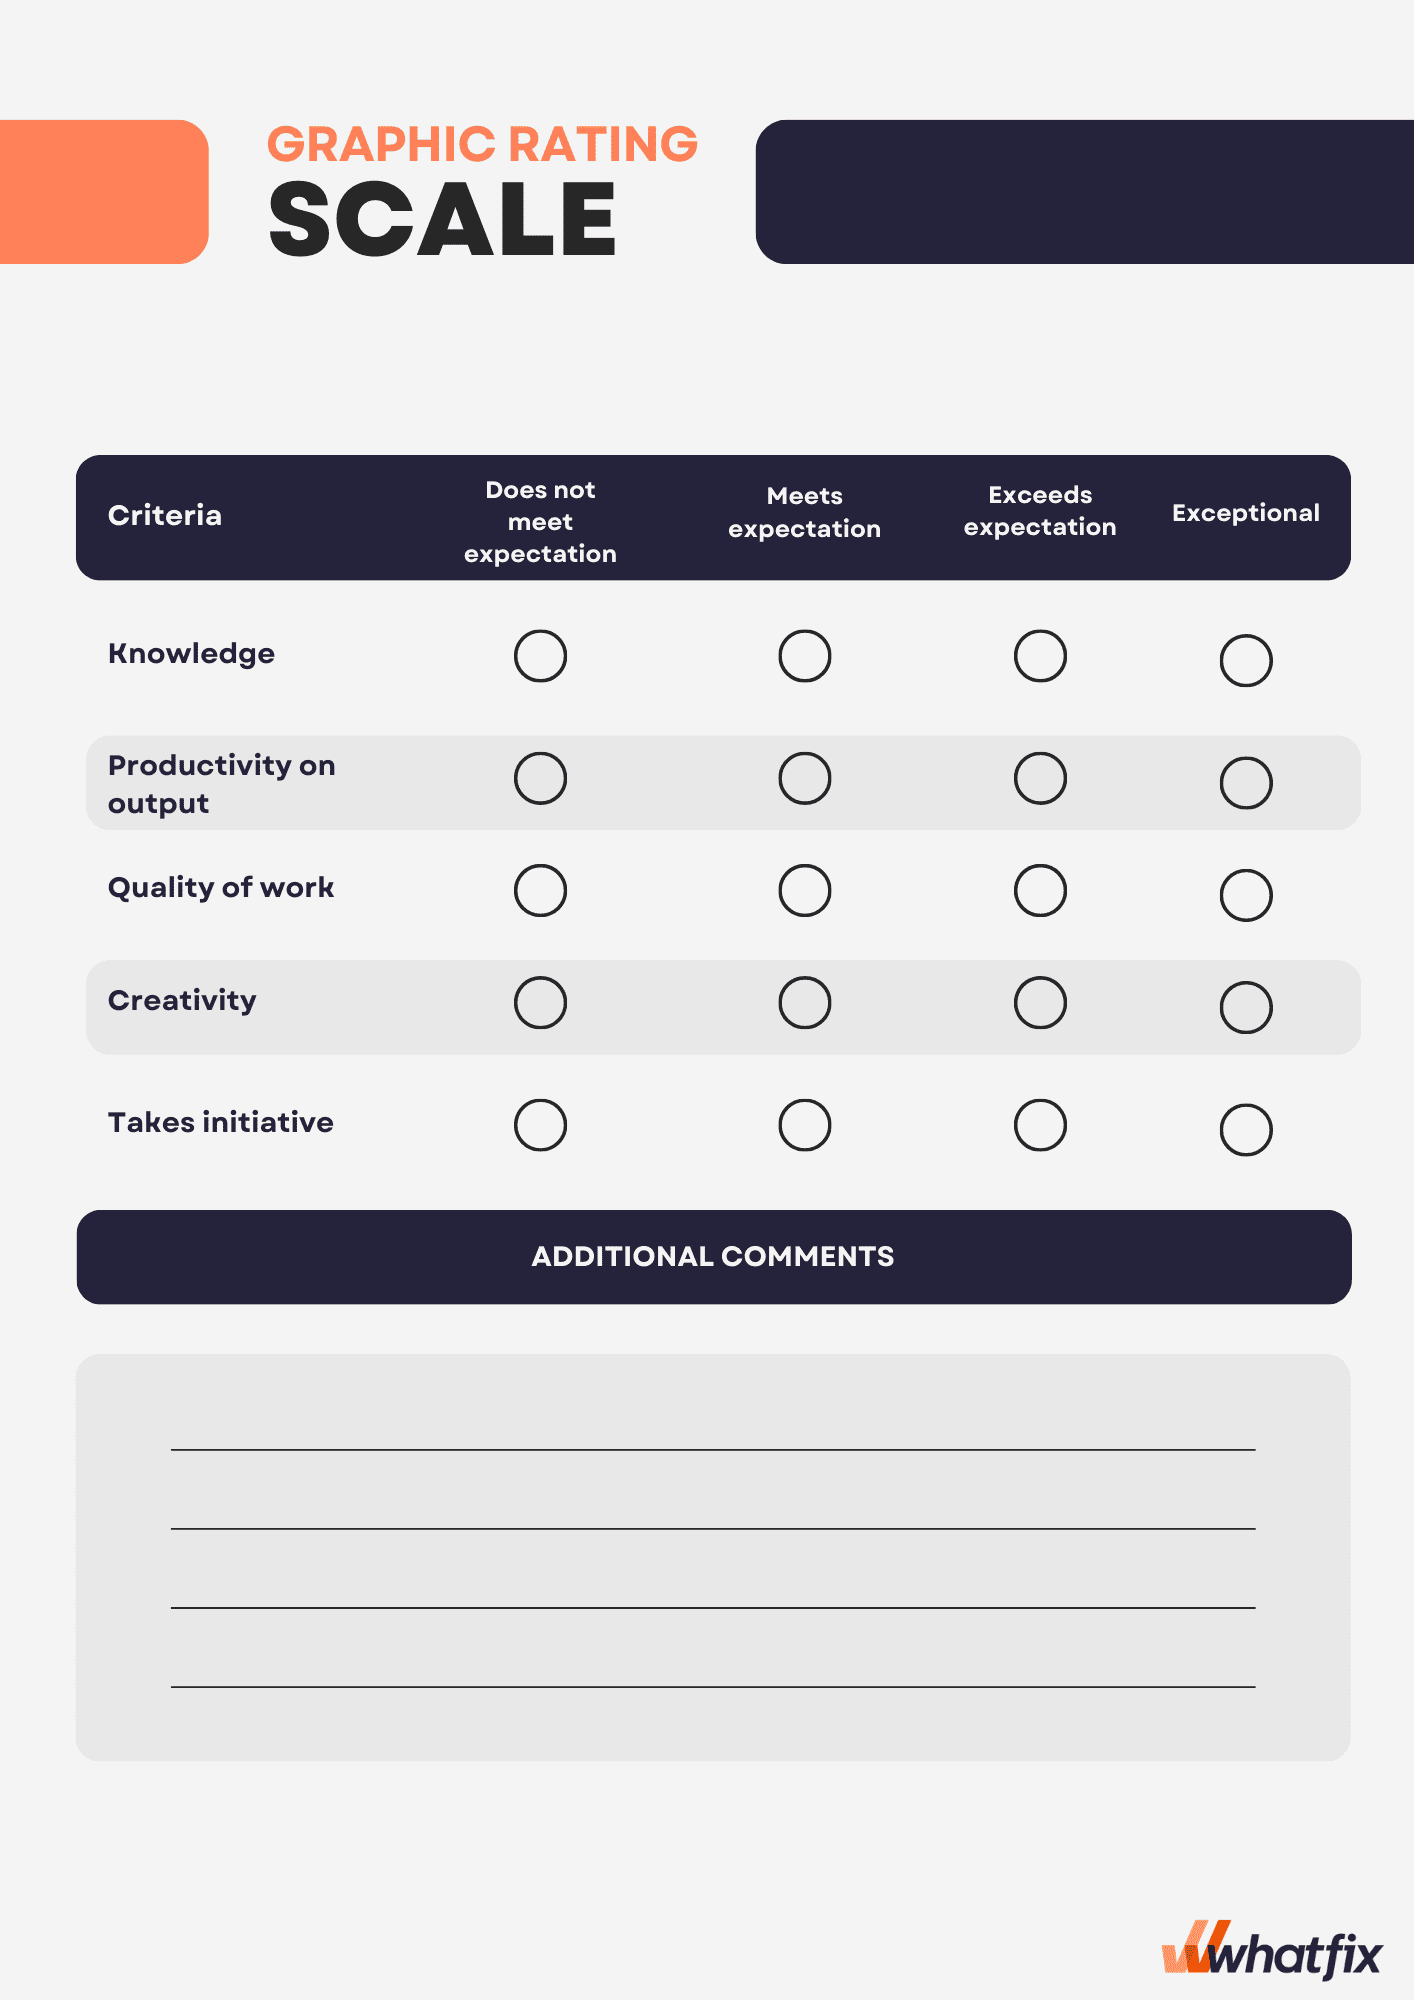
Here are some examples of graphic rating scale formats.
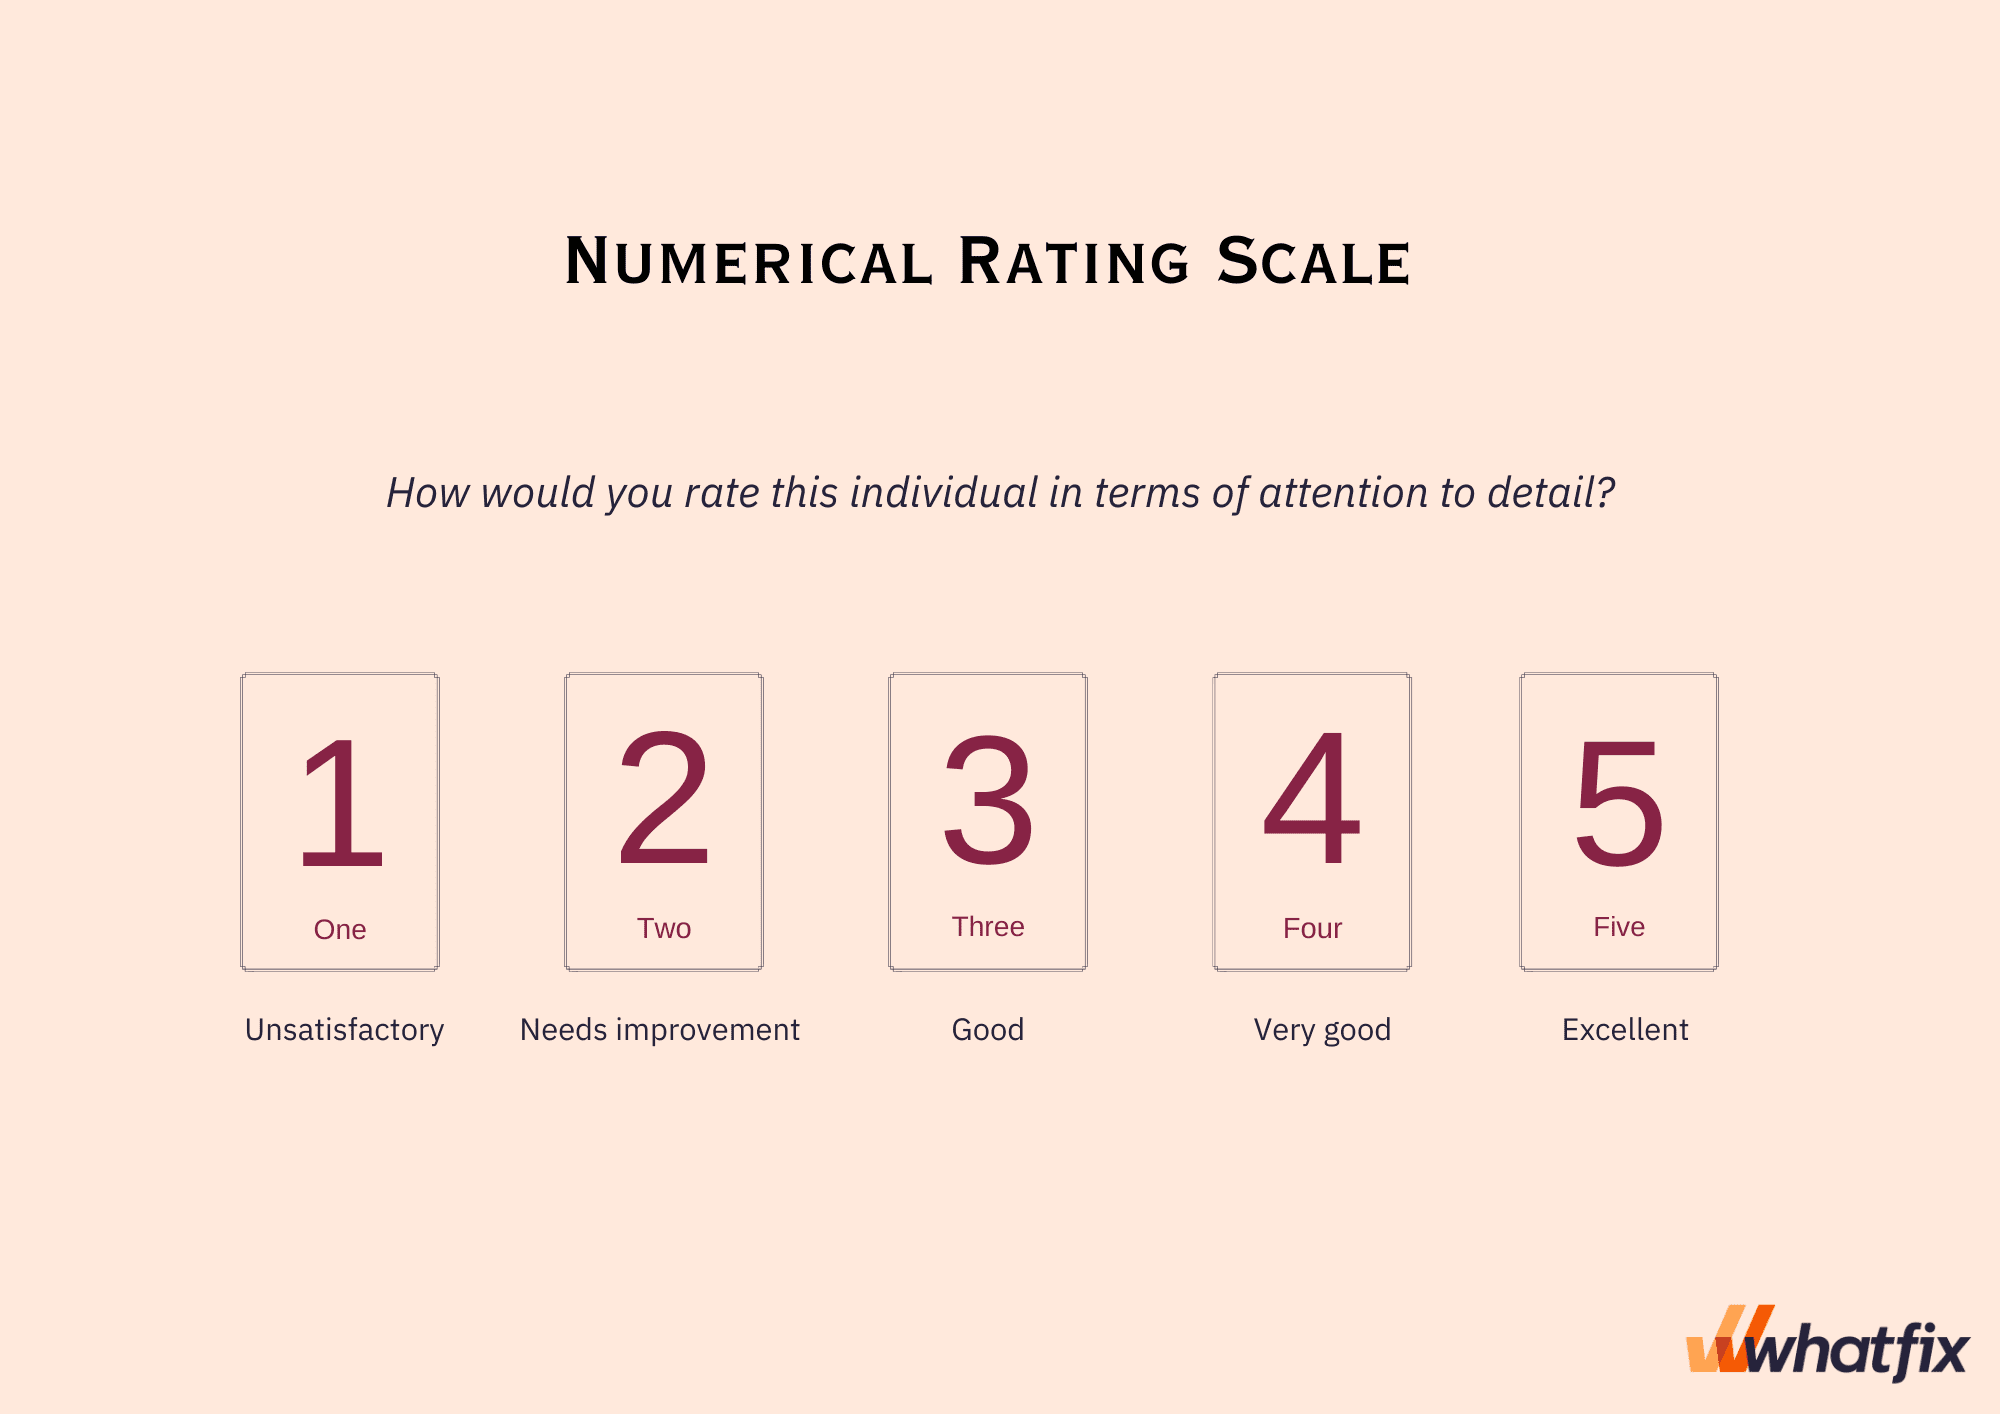
Assigns a numerical rating to an employee’s performance in a given area. In a five-point rating system, a rating of 1 indicates unsatisfactory performance, while a five indicates that the employee is performing exceptionally well in that category.
The wider the range of numbers, the more specific managers can get with their ratings.
Numerical rating scales work well for assessing components of broader career goals or performance on specific projects.
Example of a numerical-rating scale question:
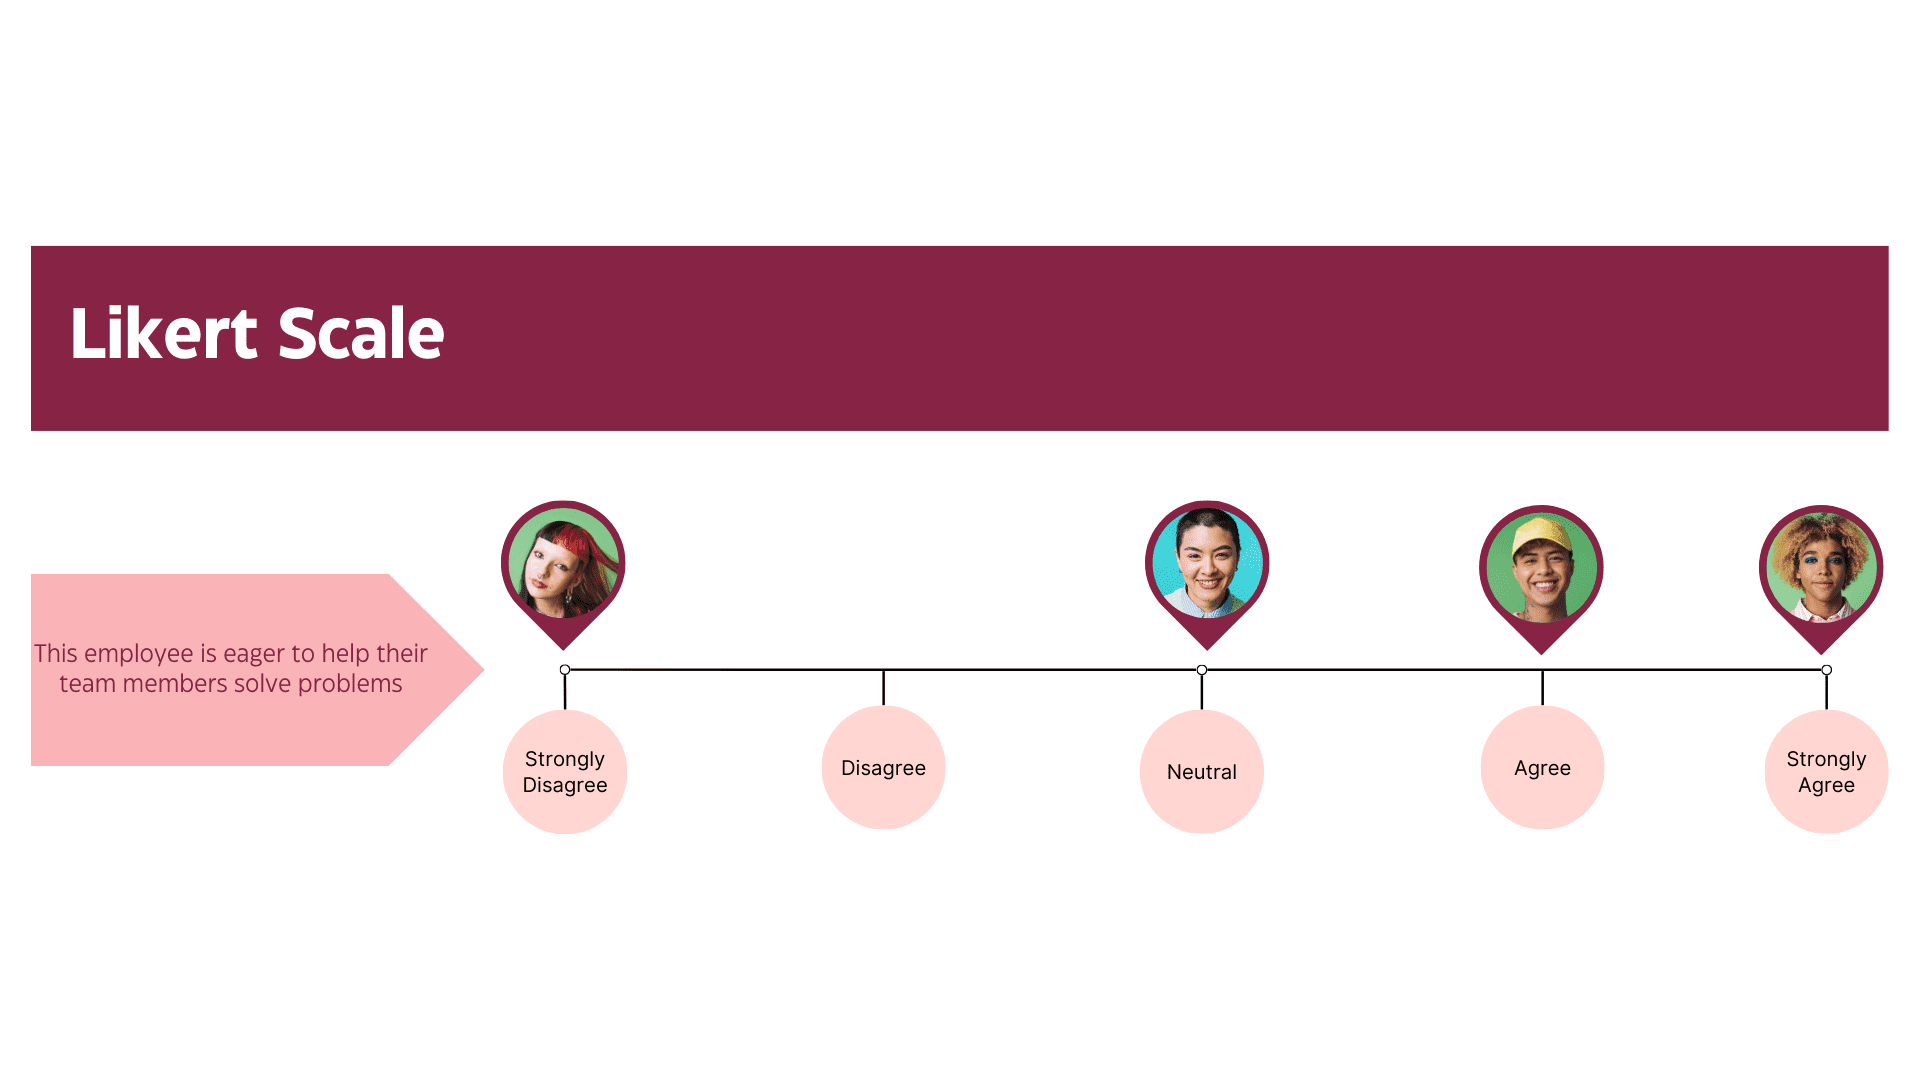
The Likert scale is descriptive rather than numerical and provides a range between 5 and 7 answers that represent how much the respondent agrees or disagrees with the prompt statement. This rating scale format tends to be better for more subjective evaluations, leaving more room for varying degrees of opinion rather than a simple “satisfied” or “dissatisfied.”
Example of a Likert scale question:
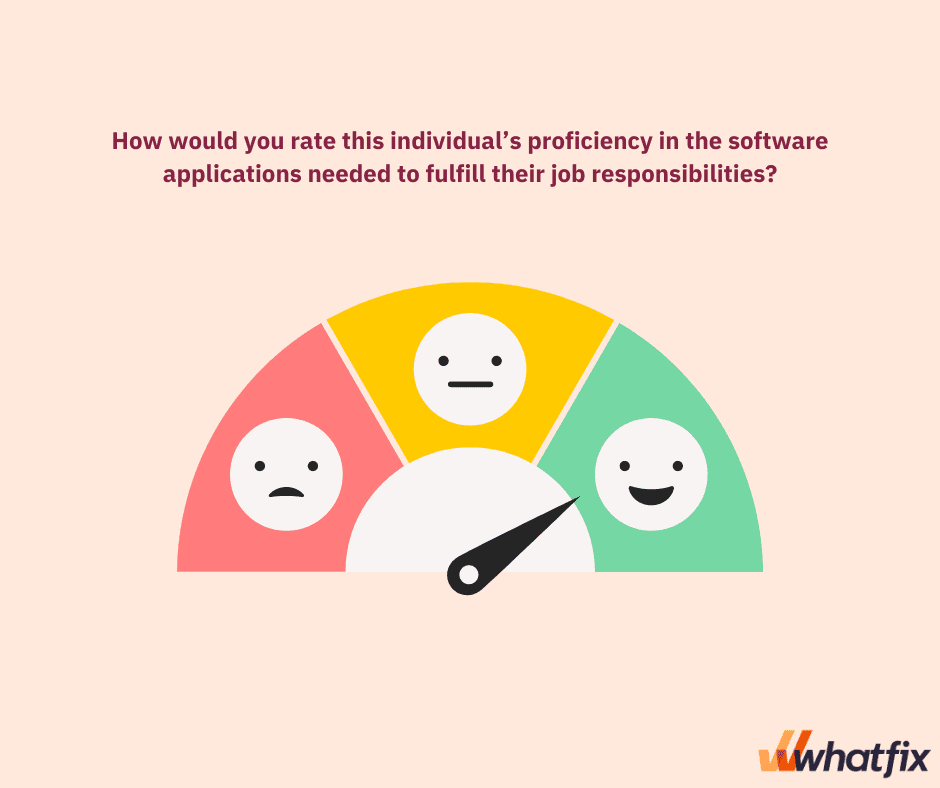
Color-coded rating scales use a range of colors rather than numbers or phrases to indicate varying levels of performance. This type of rating scale has been used for hundreds of years, and historically, the colors varied much more than they do today. With the invention and subsequent prevalence of traffic lights, the scale has generally shifted to match: green for good, red for bad, and yellow for neutral.
Green – Fully proficient
Yellow – Understands the applications and can complete most tasks without assistance
Red – Lacks a basic understanding of the applications’ purpose and how to use them.
To add more nuance to the range of possible answers, other colors along that gradient can be incorporated as well.
Example of a color-coded scale question:
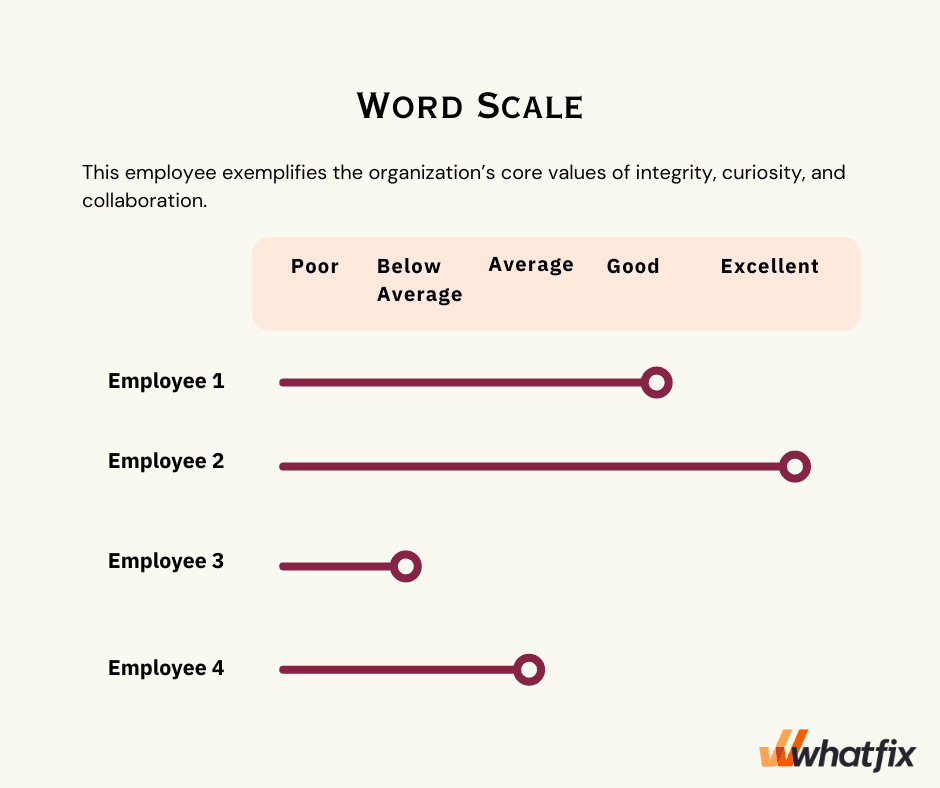
Word-based rating scales use specific phrases used to rank an employee’s performance. These phrases might differ across roles but often vary on a theme of poor, fair, good, and excellent.
Example of a word scale question:
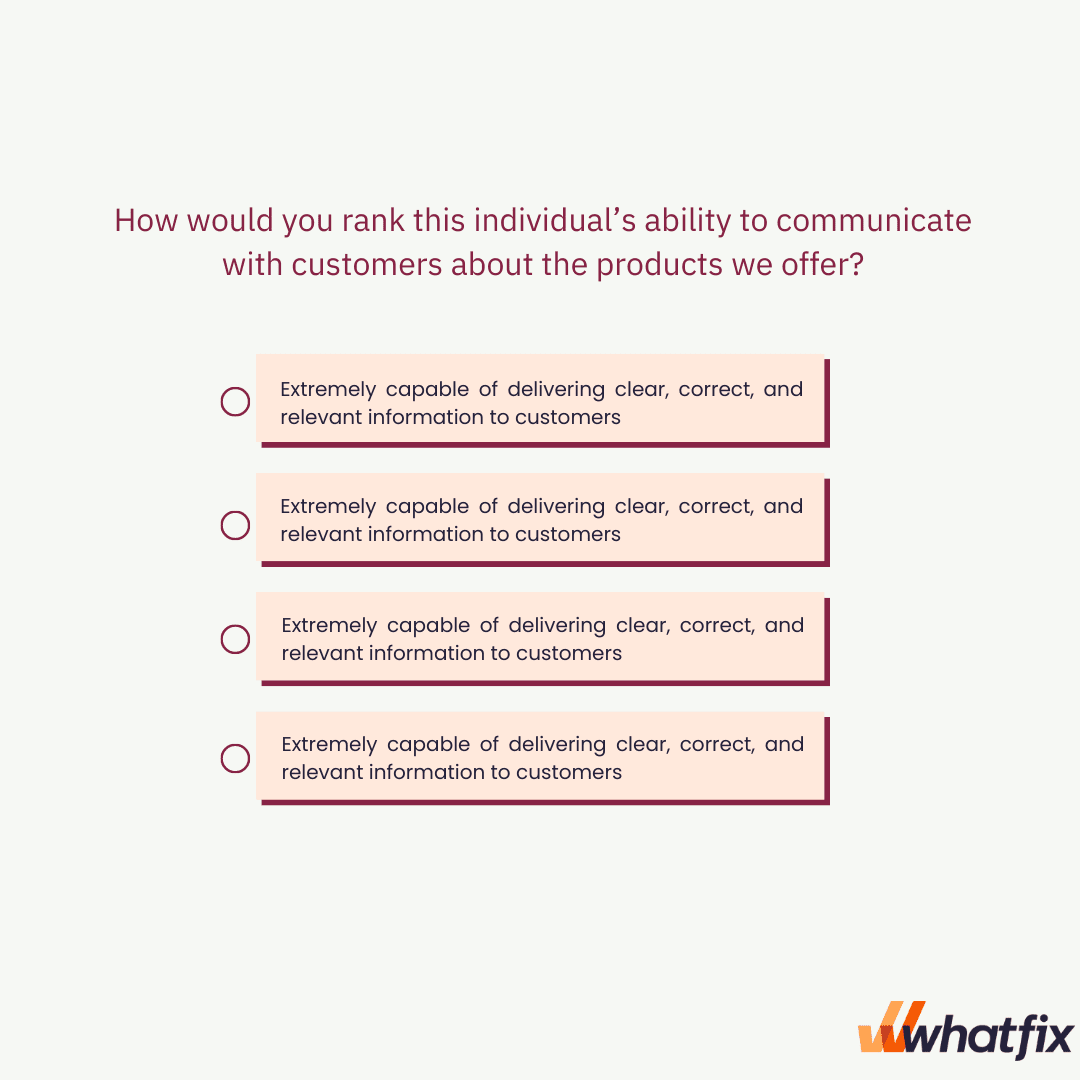
With the comment scale, the possible answers consist of longer phrases or comments rather than single words or short phrases. This type of scale works well for ratings that require more description or qualification or relate to specific operations of the organization.
Example of a comment scale question:
Using a graphic rating scale for employee performance evaluations has many benefits, including:
Because respondents are required to select from a list of answers rather than providing original comments, the graphic rating scale allows managers to perform a more standardized assessment with less room for subjectivity than with open-ended answers. While there is no way to be confident that all respondents will interpret a scale the same way, the standardization of answers will provide a baseline.
The graphic rating scale is a very straightforward assessment method that is fairly easy to explain to team members. This tool is familiar to managers and employees, so neither party feels like the review process is detracting them from work.
By assessing employee performance in a single, systematic way, all evaluations can be quantified and analyzed systematically so long as the bias is accounted for. With the graphic rating scale, there is no need to convert or translate responses, allowing managers and organization leaders to identify important patterns and trends in employee performance and take action as necessary.
Because of the simplicity and familiarity of the graphic rating scale, integrating this tool into the performance assessment process takes very few man-hours and requires no additional training. This makes the entire process incredibly cost-effective. Rating systems and criteria can be determined internally, distributed quickly, and completed with little fuss.
Here are some of the limitations to consider before implementing a graphic rating scale.
The use of more discrete numbers and categories in graphic rating scales means that managers will need to make judgment calls when employees fall somewhere in between the available options. Even further, the static nature of the rating descriptions may prevent workers from internalizing more nuanced or even positive feedback.
Even the most straightforward assessment formats can get bogged down by bias. Different evaluators may interpret questions differently or score the same employee differently based on existing biases, priorities, and perceptions.
When rating their team members’ performance, managers tend to pull from the experiences and observations they remember most clearly, which tend to be the most recent ones. It can be helpful for managers to keep logs of periodic observations to refer to at the time of performance reviews.
When numerical scores are used to evaluate employee performance, individual ratings are often added up into a total score, which allows a particular strength or weakness in a given area to skew the perception of an employee’s overall performance. For this reason, it is vital to ensure that the assessment covers a wide range of performance indicators.
Here are some tips for you to use a graphic rating scale efficiently.
Every assessment needs to be built upon a well-defined set of goals and criteria for measuring where an employee is on their journey toward reaching them. Use these criteria as a starting point to begin crafting the questions that need to be asked to conduct optimal performance reviews.
Rating levels, whether discrete or continuous, must be well defined and based on a set of criteria that employees might meet – or not. These descriptions help managers avoid bias in their assessments and ensure that employees understand the ratings they receive.
Another key component of guarding against biases is to train managers on how to use the graphic rating scale. HR teams must train managers to ensure that they are interpreting the questions and potential answers in a way that aligns with the desired outcomes of the performance reviews.
The graphic rating scale works best when combined with other question formats and appraisal methods, such as rankings, checklists, and short-answer questions. This minimizes some of the potential risks associated with the graphic rating scale, providing a more holistic, accurate set of data to analyze and incorporate moving forward.
Throughout the performance review process, it is crucial for HR teams to emphasize the importance of consistency when completing performance assessments. This not only touches back on the issue of bias but ensures that the data collected is helpful in making changes and directing the organization and its employees toward success.
To avoid bias and reach a more accurate end rating, organizations must use multiple evaluators when possible. For instance, an employee might not only receive performance evaluations from their immediate supervisor but higher-up managers and more minor project leaders. This way, ratings can be averaged and understood at a variety of levels.
After evaluations, solicit feedback from managers and employees to determine areas for improvement. For example, an evaluator may not feel that the range of answers allows them to provide feedback that can be readily interpreted and acted upon by employees. Employees may also wish to contribute suggestions for additional areas to be rated on to showcase aspects of their job they feel they excel at. Doing this can illuminate any gaps in the characteristics being assessed or the need for questions to be formatted differently, or for ranking criteria to be clarified.
As mentioned previously, some bias is inherent in any type of evaluation that relies on human perception or interpretation. These biases should be kept top-of-mind throughout the evaluation process, incorporated into assessment summaries, and addressed as necessary to help employees and managers develop a clear picture of an employee’s performance and the necessary steps for improvement in the future.
The graphic rating scale is a powerful tool for performance evaluation. This format provides organizations with a standardized and fair way to assess employee performance. When used in thoughtful ways with other methods of assessment, the graphic rating scale can give managers and HR teams important insights into employee experience and development, paving the way for success across the organization.
With Whatfix’s performance support system, create in-app guidance to boost user performance with interactive walkthroughs, smart tips, onboarding task lists, self-help wikis, and more. Whatfix’s just-in-time performance support software is always available to aid employees in performing critical tasks at the moment of need across your software applications and digital processes.
Ready to learn more? Schedule a free demo with us now!


Thank you for subscribing!