A company’s IT infrastructure is the backbone of its operations. IT infrastructure improves employee and end-user experience and satisfaction when implemented and utilized correctly, empowering organizations to maximize productivity powered by technology.
But managing IT services is complicated and time-consuming — and even more so without a clear management strategy or IT framework in place. To get the most out of IT services, you need to be proactive about creating and optimizing your services.
This is where IT service management comes in – commonly referred to as ITSM. Let’s walk through everything you need to know about ITSM, and how to find and use ITSM tools.
What Is IT Service Management (ITSM)?
Information technology service management (ITSM) is an umbrella term that describes the systems and processes a company implements to ensure IT services are properly optimized and utilized across the organization. ITSM aims to improve IT service quality, consistency, and availability. ITSM can include everything from service strategy and design to operations and improvements. The entire IT service lifecycle is managed under ITSM.
What Is the Difference Between ITSM, ITIL, and DevOps?
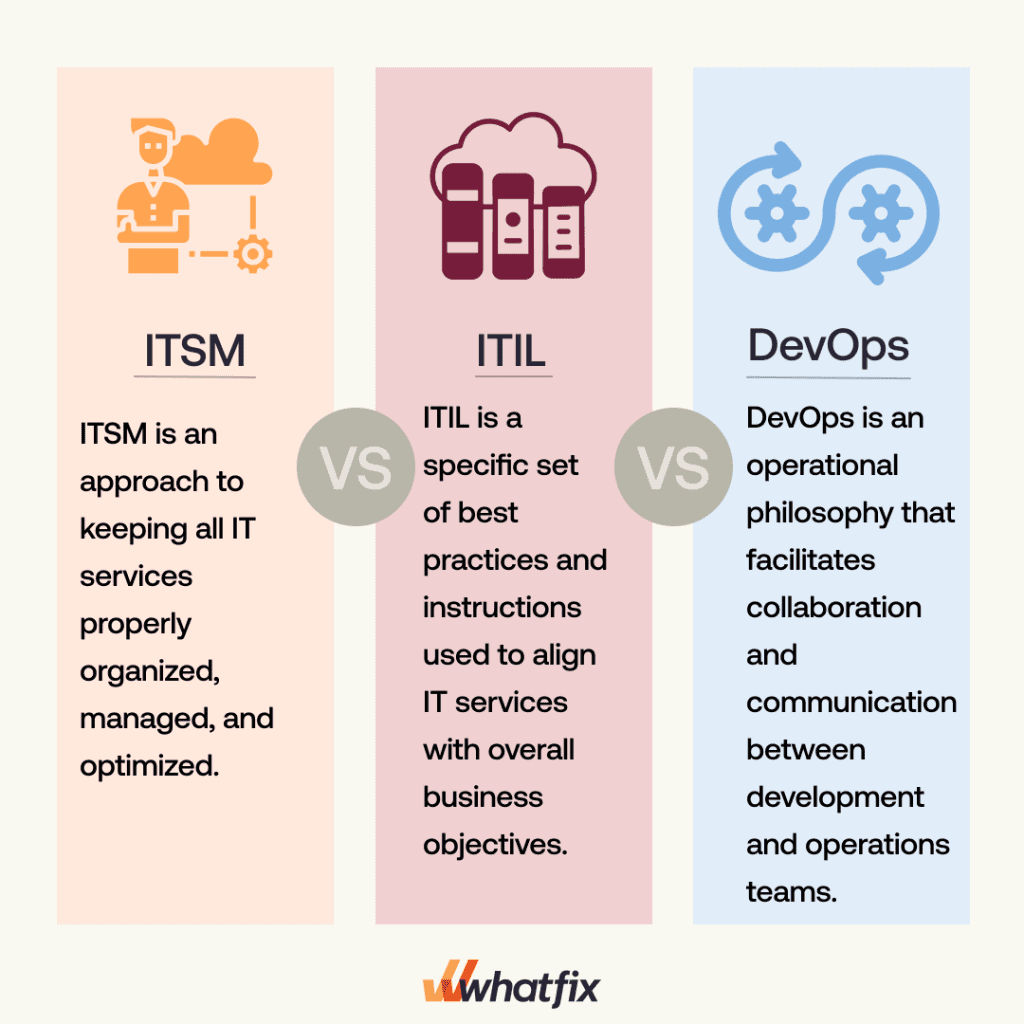
ITSM isn’t replacing your information technology infrastructure library (ITIL) or DevOps teams. They all work best when connected. Here’s a quick overview of the difference between ITSM, ITIL, and DevOps:
- ITSM is an approach to keeping all IT services properly organized, managed, and optimized.
- ITIL is a specific set of best practices and instructions used to align IT services with overall business objectives.
- DevOps is an operational philosophy that facilitates collaboration and communication between development and operations teams.
Benefits of ITSM
ITSM helps companies better manage and control their IT infrastructure. Here’s how that benefits the organization:
- Faster digital transformation enablement: ITSM ensures IT services are aligned with business goals and provides a framework for implementing new technologies, enabling organizations to embrace digital innovation and take on digital transformation initiatives more efficiently.
- Reduced downtime: ITSM puts key standardization, maintenance, and monitoring processes in place, reducing the risk of system failures and minimizing downtime.
- More efficient IT resource deployment: ITSM provides structure to service planning and design, including how to allocate resources based on priorities and business needs.
- Improved end-user support: ITSM standardization creates service consistency and improves response and resolution times, as well as enables IT governance.
- Better IT analytics and reporting: ITSM uses data-driven analysis to make identifying trends, issues, and areas of opportunity or improvement easier.
- Stronger IT process development: ITSM looks for opportunities to improve and optimize IT processes throughout the entire lifecycle, leading to better systems.
- Increased IT transparency: ITSM provides more visibility into IT operations and processes, making it easier to develop insights related to costs, utilization, and collaboration.
Types of ITSM Processes
ITSM processes manage and optimize IT services and ensure services align with overall business objectives. Let’s cover a few key ITSM processes.
1. Service request management
Service request management and fulfillment involves processes that ensure standard requests are handled timely and efficiently. Service request management processes provide users with the appropriate resources and support and create standardization and consistency from request to request.
2. Incident management
Incident management processes bring operations back to normal after an incident. Incident management software provides the infrastructure that enables teams with instructions for analyzing, logging, and prioritizing incidents based on impact and urgency.
3. Problem management
IT problem management processes usually go hand-in-hand with incident management processes. Problem management looks for recurring incidents and ongoing service problems to help identify and address the root issues and prevent future incidents from occuring.
4. Configuration management
Configuration management processes keep configuration items within an IT environment up to date. As the IT infrastructure changes and adjusts to evolving needs, configuration management processes ensure the integrity of the IT environment isn’t compromised.
5. Change management
Change management processes oversee and control major changes to IT infrastructure or service options. Not only do change management processes provide standardized instructions for introducing or eliminating new IT to the organization, they also ensure operations continue to run as smoothly as possible throughout the change lifecycle.
6. Knowledge management
Knowledge management processes refer to the steps taken to capture, organize, and share company information. These processes help improve decision making, training, and problem resolution while also reducing errors or mistakes.
7. Service catalog
An IT service catalog is a list of all IT services offered by a company. Service catalog processes focus on maintaining the list of available services in a user-friendly manner. This might include service descriptions and availability.
8. IT service desk
An IT help desk is a point of contact for users to report issues, ask questions, or find out more information about IT services. Processes associated with the IT service desk include submitting and responding to requests, logging and organizing request records, and more.
9. Service level management
Service level management oversees service level agreements (SLAs) and ensures customer and user expectations are met. Service level management processes maintain high-quality service delivery and performance.
10. Continual improvement management
IT services need to be continuously updated and improved upon. Continual improvement management processes are used to analyze service performance and identify opportunities for improvement. These processes prevent IT services from becoming outdated and maintains alignment with changing business needs and requirements.
11. Workflow and talent management
Workflow and talent management processes make sure team members and employees have the necessary skills and training to work with various IT services in order to meet business goals. These processes cover designing and optimizing workflow, training and educating employees, and hiring appropriate new talent.
12. Asset management
Asset management processes keep IT software, hardware, and resources organized and updated. Asset management processes help control costs, ensure compliance, and improve decision-making by making sure the appropriate IT assets are available and properly utilized.
Examples of ITSM Service Requests
Here are specific examples of common ITSM service requests:
- “I forgot my password and need assistance resetting it.”
- “I need to install new software onto my work computer.”
- “I need access to a specific folder to collaborate with my team on a project.”
- “My work computer is no longer functioning properly and I need a replacement or repair.”
- “My email address has changed and I need to update all configurations on all devices.”
IT Metrics and KPIs to Track
- Availability: Measures the percentage of time that a system is available for users.
- Uptime: Measures the percentage of time that a system is up and running for users to perform intended functions.
- Response time: Measures the time a system takes to respond to a user request, like clicking on an on-page element, loading a page, or making a purchase.
- User satisfaction: Measures how pleased a user is with a system’s ability to meet their expectations.
- Error rate: Measures the percentage of failures or disruptions in a system’s functionality.
- Time to resolution: Measures the time it takes for IT or support teams to identify and resolve issues within a system.
- Capacity utilization: Measures the percentage of available production capacity a system can use to perform efficiently.
- Bandwidth utilization: Measures the percentage of available network bandwidth a system has to process intended functions and requests.
- Cybersecurity incidents: Measures the number of cybersecurity incidents within a system and how it impacts the system and its users.
- Cost of IT operations: Measures the total cost of implementing, operating, and maintaining IT systems and related data infrastructure.
- Adoption rate: Measures the percentage of total users that use a new system or application at a desired frequency level for its intended functionalities and use cases.
Best ITSM Tools
ITSM tools make it easier to manage your IT services, workflows and requests. Here are the five top ITSM tools to consider:
1. Whatfix
Whatfix is a digital adoption platform (DAP) that provides on-demand support and in-app assistance to users. With Whatfix, you can add in-app guidance and self-help support to your app or website, allowing your end users to solve problems and answer questions independently.
With Whatfix, enable your application end-users with contextual, role-based guidance and assistance such as:
- Tours and Task Lists that enable new end-users with guided in-app walkthrough of new applications and provide a contextual path for different roles to use these new tools quickly.
- Flows that enable end-users with in-app, step-by-step guidance on core software processes and tasks for CRMs, ERPs, and any enterprise software process.
- Smart Tips that provide contextual information and nudges end-users to take specific actions based on where they are in a digital process.
- Pop-Ups and Beacons that alert users of company announcements, new app features, process changes, and more.
- Field Validation that ensures end-users enter data in the correct format, in full, and drive data hygiene.
- Self Help that provides an on-demand resource center complete with all IT service support in a searchable wiki that embeds your technology stack’s UI.
With behavior analytics and reporting, Whatfix shows you exactly what services your users might be struggling with so you can make the necessary improvements.
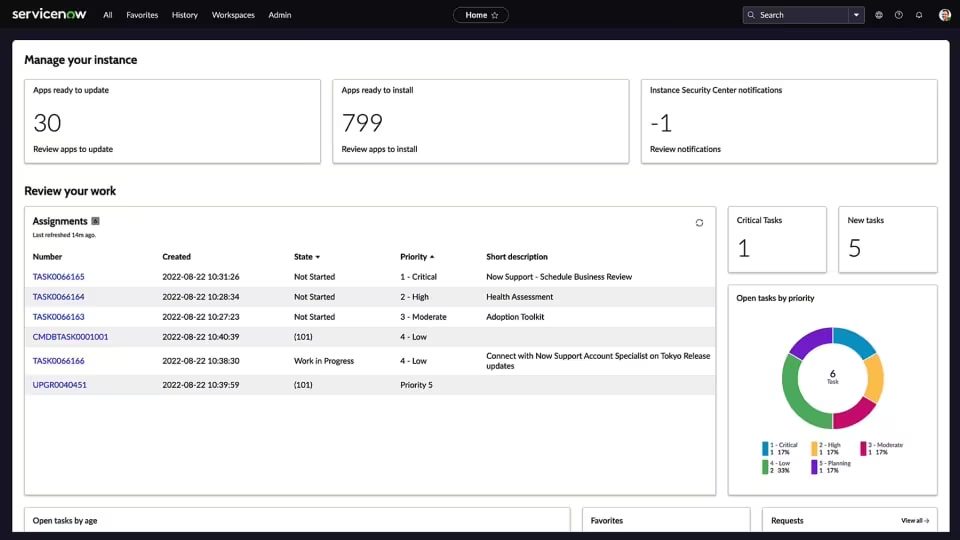
2. ServiceNow
ServiceNow is a cloud application platform that provides real-time data and actionable insights to help you deliver better services to end users. The ServiceNow platform can automate your business processes, provide AI-based assistance, and manage incidents, changes, and all your company knowledge. Moreover, its flexibility allows seamless integration with a variety of tools and platforms, enhancing the overall efficiency and collaboration within your IT Service Management ecosystem.
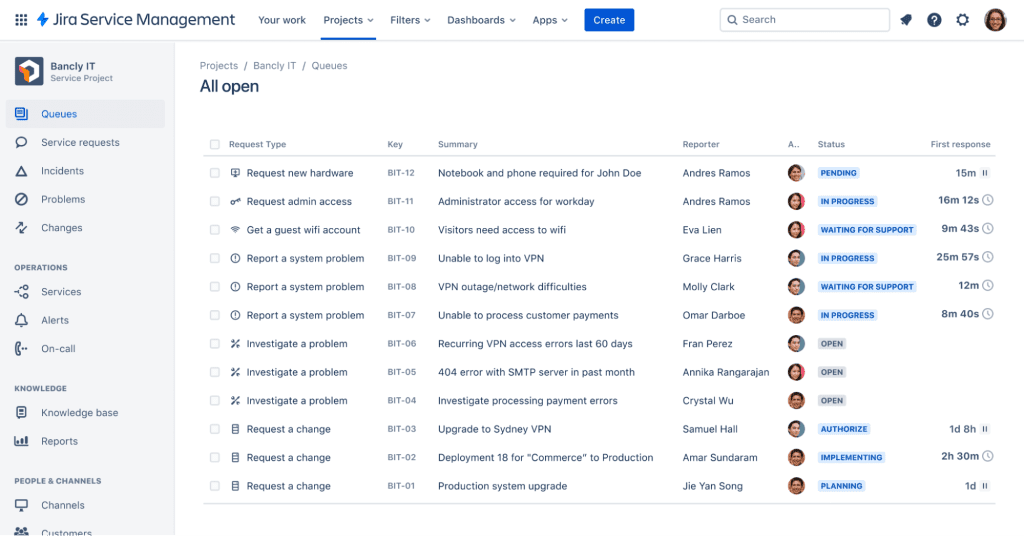
3. Jira Service Management
Jira Service Management connects your IT, development, and business teams teams together to easily manage high-velocity service requests. Jira Service Management makes collaboration easy, creating the right environment to deliver valuable IT services quickly and at scale.
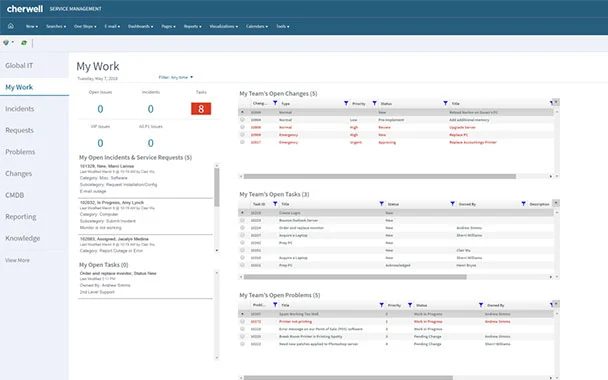
4. Cherwell
Cherwell is an enterprise-grade ITSM that offers much-needed platform flexibility. Cherwell covers everything from incident and request management to discovery and dependency mapping. The Cherwell Marketplace offers additional features and tools to customize capabilities and build an even more powerful solution.
5. FreshService
FreshService is a modernized service management tool that uses AI and automation to help employees efficiently address requests and minimize downtime. It provides a real-time view of your IT infrastructure and assets, and makes planning and implementing service changes and project plans easy.
How to Choose an ITSM Solution
When choosing what ITSM solution is best for your company, here are five things to consider:
- Capabilities and features: Having a feature-rich tool is great, but don’t break your budget paying for capabilities for features you don’t need. Make a list of your must-have ITSM abilities before you invest in a tool.
- User experience: If your ITSM solution is difficult to use, it won’t provide value to your team or end users. Look for an option with an easy-to-use interface and lots of user support.
- Flexibility: You need an ITSM solution that can support all your various IT service needs. A flexible tool will make it easier to keep up with changing needs and demands.
- Collaboration capabilities: Being able to collaborate with team members directly in your ITSM solution will improve productivity and help you provide better service and support.
- Scalability: Choose an ITSM tool that is able to grow with you. Look for options that are scalable and will fit your budget as your company grows.
Software Clicks Better With Whatfix
Make it easier to manage your ITSM initiatives with Whatfix. With Whatfix, enable your end-users with in-app guides and deflect IT support issues with self-help support. With Whatfix, you can provide users with the exact, contextual resources and instructions they need for their specific roles and responsibilities, and get the most out of your IT services. With end-user behavior analytics, you can continuously refine digital strategy by identifying areas of end-user friction, building optimal digital workflows, have a holistic view of software license usage, and drive end-user adoption to maximize IT and software ROI.