Ultimate Guide to SaaS Customer Success (2024)
- Published:
- Updated: July 2, 2024

The most successful software-as-a-service (SaaS) companies have one thing in common — they lead with a customer-centric approach that prioritizes customer’s needs. They’ve learned that developing deep relationships with customers isn’t just considerate; it’s necessary to drive long-term customer and revenue growth.
Customer success has become synonymous with SaaS. As soon as a customer has signed a contract, it’s time to start offering hands-on, detailed customer success that helps each customer contextually meet their outcomes and goals – or risk losing that logo when it’s time for renewals. It’s critical to continually prove to your customers that they made the right decision to do business with you.
When you proactively give your customers the right tools and information to successfully solve their problems, you significantly increase the probability your customers will stay with you for the long haul.
In this article, we’ll explore SaaS customer success, its critical role for SaaS companies, how to measure and improve it, and more.
What Is Customer Success?
Customer success is the people, process, and support your company invests in to advance your customer’s goals and help them achieve the results they’re aiming to get by using your product or service.
Commonly led by a customer success manager, a customer success team is tasked with reducing customer churn and increasing customer retention by providing an exceptional experience throughout every stage of the customer relationship. They jump in when a customer gets serious about signing up for your product. Once a prospect converts, they oversee customer onboarding and training, assist with support, and offboard customers as they churn.
The underlying strategy of a customer success team is rooted in the analysis and understanding of your customer’s goals and, in turn, being proactive in helping them achieve success with your product in whatever way they can.
Customer Success vs. Customer Support vs. Account Management
Customer success and customer support often overlap, but they are not the same entity.
- Customer support is issue-driven, while success is mainly goal-driven. Support is more reactive — like responding to a trouble ticket.
- Customer success teams are more proactive by seeking out potential red flags and fixing issues when a customer becomes a churn risk.
- Account management is focused on expansion. Account managers typically have a set number of accounts they’re responsible for and focus on nurturing clients through upsells and feature upgrades.
The Importance of Tracking SaaS Customer Success Metrics
Companies with substantial customer success grow faster by reducing the revenue decline caused by churn. Decreasing uncertainty through after-the-sale service and building deep relationships with customers increases the probability of renewals. Happy customers lead to additional selling opportunities and more referrals, which increases revenue with minimal extra effort.
Establishing a customer success team will help you build better products and services by identifying and understanding your customers’ needs. Customer success can act as the voice of the customer inside your organization and educate your sales, marketing, and product teams to make sure everyone has accurate information about your customer’s needs and requests.
11 Key SaaS Customer Success Metrics to Track
There are a few key metrics that can help measure customer success for your SaaS company. including:
1. Customer Churn Rate
Your customer churn rate is a foundational customer success metric that tracks the percentage of your customers who have decided not to renew. This metric is essential to monitor because it shows you how many customers aren’t seeing value in your product or customer success efforts.
To calculate your churn rate, divide the number of customers who no longer subscribe in one month by the total number of customers you had at the beginning of that month. There’s no universal number for what your churn rate should be, but the average amount of monthly churn for SaaS companies hovers just under 5%.
Customer Churn Rate = (Users at beginning of a period – users at end of a period) / users at beginning of period
2. Average Revenue Per User (ARPU)
ARPU is the total revenue your product generates across all your customers. Determining your ARPU helps you find opportunities to optimize your pricing and positioning by displaying how much money customers are willing to spend on your product – and is a critical KPI for SaaS companies.
To calculate ARPU, take the revenue generated from subscriptions in a month and divide it by the average number of your subscribers over that period. For example, if you had 1,000 customers last month and generated $50,000 in revenue, your average revenue per customer would be $50.
ARPU is dependent on such factors as your pricing model and industry. To establish your benchmark, try to find the ARPU of your competitors or an average for your sector.
Average Revenue Per Use (ARPU) = Total revenue / total # of users
3. Monthly Recurring Revenue (MRR)
MRR is another foundational metric that measures your predictable revenue. It’s the amount of recurring revenue you generate in a given month after subtracting one-time fees. This metric uncovers the quality of your revenue and shows investors that your company is capable of generating income.
For subscription-based businesses, the simplest way to calculate MRR is to add up a month’s worth of your recurring revenue. There’s no industry benchmark for MRR — the value is in tracking it internally over time to see if your revenue is growing or shrinking.
Monthly Recurring Revenue (MRR) = (Total # of active customers) X (average billed amount)
4. Customer Acquisition Cost (CAC)
Customer acquisition cost is the amount of money you spend to persuade a consumer to buy your product. This metric is critical to track because it tells you how much time it will take for a customer to become profitable — if it’s too high, your business may not succeed in the long run without adjustments.
To calculate CAC, add up all your sales and marketing expenses (including salaries) and divide that number by the total number of customers added in the specific period you are measuring — for example, your annual costs divided by the total number of customers you added in a calendar year. For example, if your company spent $100,000 to land 10,000 new customers in a month, your CAC is $10.00.
CAC varies among industries and is closely tied to where you set your marketing and sales budget. A good way to tell if your CAC is healthy is to calculate your CLV to CAC ratio. A ratio of 4:1 means every dollar gets you $4 back in customer lifetime value.
Customer Acquisition Cost = (Marketing costs + salaries + professional costs + sales costs + software costs) / # of customers acquired
5. Customer Lifetime Value
Customer lifetime value (CLV), also known LTV, is the dollar value of a customer over the life of your relationship with them. Knowing your CLV can help you determine how much you should spend on acquiring customers — the amount you spend should depend on how much a customer is worth. This makes it one of the most important KPIs for SaaS customer success teams.
There are several ways to calculate CLV — a simple approach is to take your annual revenue per customer, multiply it by the length of your typical customer relationship in years, then subtract your CAC. This calculation will give you a general idea of how much revenue you can expect from a customer while they’re subscribed to your product.
For example, if your average annual revenue per customer is $5,000, your customers stay with you for five years, and your CAC is $100, your CLV would be $24,900.
Customer Lifetime Value = (Average purchase value – average purchase frequency) x average customer lifespan
6. Net Renewal Rate
Your renewal rate measures how many customers stick around after their initial subscription expires. Tracking this customer success metric over time will allow you to notice and fix any downward renewal trends before they become a big issue. It also helps benchmark performance for your customer success managers.
Customer renewal rate is measured using different periods, like months or years. To calculate this metric, divide the number of customers who paid their subscription fee by the total number of customers up for renewal, then multiply by 100 to get your rate. For instance, if you have 2,100 monthly subscribers who paid and billed 2,200 subscribers, your renewal rate is 95%.
There’s no gold standard among SaaS companies for renewal rates, but higher numbers generally equal healthier companies.
Net Renewal Rate = ((Revenue renewed + Expansion revenue) / Revenue that can be renewed) x 100
7. Expansion Revenue
Expansion revenue is a metric that tracks the percentage of revenue coming from existing customers through non-subscription revenue like upselling and cross-selling. It can help you determine which customers are so satisfied they want to buy additional products from you and highlight which products may be a good fit to market to other customers. This customer success KPI proves that SaaS customer success teams can be a leading driver of organizational revenue growth.
Track expansion revenue by dividing your revenue during a previous time period by the amount of new, non-subscription or contract revenue during a specific time period. Using a monthly calculation as an example, if you ended last month with $10,000 in revenue and gained $1,000 in cross-sell and upsell revenue during the next month, your expansion revenue rate would be 10%.
As a benchmark, expansion revenue should make up 20-30%+ of monthly revenue. For many SaaS companies, this number tracks closer to 10%.
Expansion Revenue = (New revenue from upsells + cross-sells in a month) / Total revenue at the end of the previous month
8. Net Revenue Retention (NRR)
Net revenue retention is a metric that tracks how your company’s recurring revenue shifts over a known period. It is similar to MRR but can be measured over extended periods and factors in expansion revenue, downgrades, and customer churn. This statistic shows how well you’re performing in terms of retention, which is a significant success driver in SaaS.
To determine net revenue retention, choose a specific period and divide your recurring revenue at the end of that period by the recurring revenue at the beginning. To track it by month, take your monthly recurring revenue at the beginning of the month, add your new monthly recurring revenue, subtract your downgrades and monthly churn, and divide that number by your MRR at the beginning of the month.
For example, if your past month’s MRR was $20,000, you brought in $3,000 of new MRR this month, and you lost $1,000 from downgrades and customer churn, your net revenue retention is 110%. A net revenue retention rate of over 100% is considered a good growth indicator for SaaS businesses.
Net Revenue Retention = (Starting MRR + Change in MRR) / Starting MRR
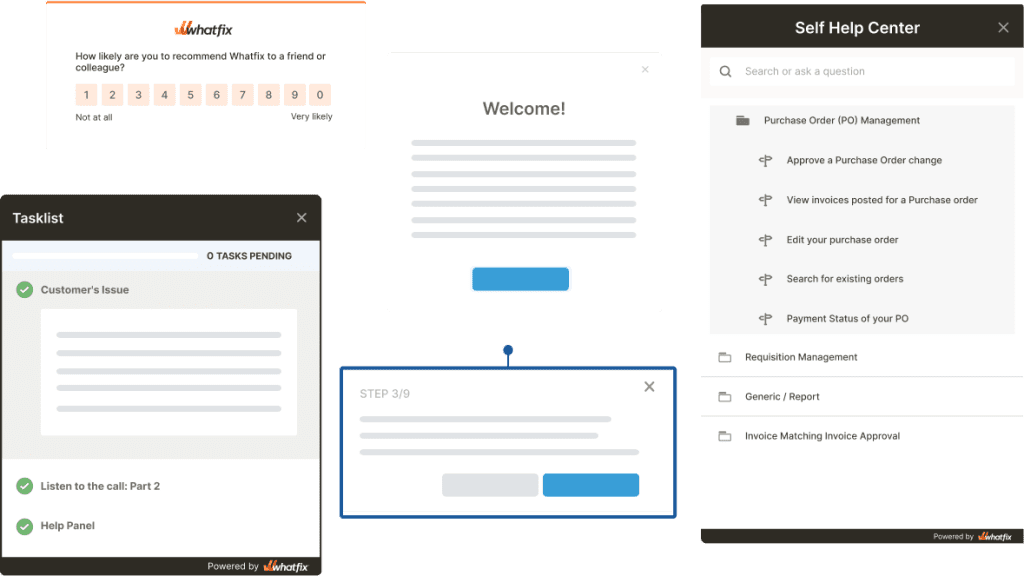
9. Net Promoter Score (NPS)
NPS is a popular customer health metric gathered through surveys that ask a specific question — “On a scale of 0 to 10, how likely is it that you would recommend our organization to a friend or colleague?” Results are based on the number a customer chooses during the survey, and when the survey is tallied, customers are classified as either “Detractors,” “Passives,” or “Promoters.”
To calculate your company’s Net Promoter Score, subtract the percentage of Detractors from the percentage of Promoters. Customers who rate you a 6 or below are considered Detractors, 7 or 8 are Passives, and 9 or 10 are Promoters. For example, if 50% of your respondents are Promoters and 30% are Detractors, your NPS is 20.
Your NPS score can vary depending on your product and customer success efforts, but the software and app industry as a whole has an average NPS score of 31.
NPS = Promoters (%) – detractors (%)
10. Customer Satisfaction Score (CSAT)
Customer satisfaction scores are measured by asking customers how satisfied or dissatisfied they are with your product and company. CSAT is usually quantified by sending surveys asking questions like “How satisfied were you with our product/service/interaction with our company?” and commonly uses a 1-5 or 1-10 scale for responses.
To measure CSAT using a 1-5 scale, take the total number of 4 and 5 responses, divide them by the total of responses, then multiply by 100. For example, if you have 100 respondents and 70 rated you a 4 or 5, your score would be 70%.
A good time to gather CSAT metrics is when you want feedback about something specific, like after an event or when a customer completes your onboarding process.
Customer Satisfaction Score (CSAT) = (# of positive scores / # of all scores) x 100
5 Tips for Creating an Effective SaaS Customer Success Strategy
The best customer success efforts are built on a solid foundation of internal data, customer insights, and a well-thought-out strategy that addresses every stage of the customer journey.
Use these best practices when ramping up your customer success efforts to help you build a solid foundation inside your organization.
1. Understand your customer's needs and pain points
It’s important to thoroughly understand the needs and challenges of your customers to provide a service that meets their requirements and helps them achieve their desired outcomes. This can be done through customer research and feedback.
Whatfix makes it simple to collect customer feedback to dive deeper into what’s missing from their experience. The digital adoption platform offers an in-app feedback icon that empowers end users to give feedback, register their requests and suggestions from within the Self Help widget, and make adjustments as necessary.
Unlike other ways of communication like email support, livechat, and ticketing that redirects the end user to respective applications, Whatfix’s feedback feature enables customers to provide in-app feedback without disturbing their flow of work.
2. Build a dedicated customer success team
Building a dedicated customer success team is the best way to show your customers you’re committed to helping them reach their goals.
A dedicated team has the bandwidth to be present for every step of your customer’s journey and offer personalized support when customers need you most. This degree of support is difficult to achieve if you don’t have an independent customer success team.
Great customer success teams are more than just product helpers — they can also act as consultants. For example, if your product is marketing automation software, your customers should be able to turn to you to improve their marketing efforts. Your customer success team can advise customers on how to craft and execute strategies using your product, which leads to greater product adoption and higher retention.
Suppose you don’t currently have the resources to build a stand-alone team. In that case, you can start by prioritizing high-value customers and assigning members of existing teams to provide high-touch support to those specific customers.
3. Create a customer success playbook
A playbook acts as a framework for your team and should include guidelines and processes for how you plan to reduce churn, improve retention, and solve customer problems. Developing a robust customer success playbook allows you to train new hires quickly, provides a structure for your team, and ensures all customers get the level of support they desire.
Your customer success playbook will be unique to your internal goals and customer needs, but a good playbook will include:
- The problem your product solves for your customer and their desired outcome.
- Internal company goals and the metrics and KPIs you’ll use to determine if you are meeting those goals.
- Your customer communication strategy includes the decks, scripts, or email templates you’ll use when interacting with your customers.
- A plan for onboarding your customers and converting them to habitual, happy users of your product.
- How to properly offboard customers and the data to collect during offboarding so you can improve your processes.
4. Use data to measure and improve your customer success efforts
KPIs and metrics are the life force of customer success — every plan you create and action you take should be based on your customer’s actions and behaviors. You can establish a single source of truth for your customer success initiatives by measuring and tracking these KPIs.
Balance your quantitative and qualitative measures to understand how well you engage your customers. Send open-ended surveys and talk to customers one-on-one to find out what they love about your product and what’s causing frustration. Checking in and collecting qualitative feedback can let you know whether your efforts are working, whether you need to make adjustments, and, if so, in what area.
With a digital adoption and analytics platform like Whatfix, customer success teams are enabled to analyze how customers are engaging and interacting with product features, flows, and processes – allowing them to identify friction points that need additional guidance, what new help content should be created, and how to contextually support each individual customer.
5. Continuously improve your service
To ensure ongoing SaaS customer success, it’s essential to continuously improve your offerings based on customer feedback and changes in their needs and requirements. This can be done through regular updates and enhancements to your service and ongoing customer surveying, research, and feature testing.
How to Build a SaaS Customer Success Roadmap in 8 Steps
In order to build a stellar customer success team, you need to create an internal road map to ensure everyone in your organization is on the same page and you don’t miss any steps in the customer journey. Here’s a chronological walk-through of each step in the customer journey so you can plan your strategy.
- Study your customer’s goals to understand what success looks like to them.
- Determine the handoff point between your sales and customer success team and craft a communication plan starting at day 1.
- Map out the touchpoints your customer success team will focus on during onboarding and implement a feedback loop to drive product and process improvement based on customer’s opinions and suggestions.
- Implement self-service support options for customers transitioning to regular users so they don’t have to choose between annoying you and flying blind. Check out customer onboarding software tools, such as digital adoption platforms, to ease this transition.
- Plan the steps you’ll execute when transitioning a customer from onboarding to a regular user.
- Identify churn risks by studying your data and talking to customers, then devise a plan to mitigate those risks with a proactive customer service approach.
- Use your data to uncover customers who would be especially receptive to upselling or cross-selling opportunities and set up a way to offer them additional products or services.
- Design a plan for when a customer wants to cancel and build an offboarding process that includes a communication strategy to maintain a good relationship.
Customer success involves a lot of tracking, analyzing, and planning, so you need to build in some breathing room to stay ahead of your customer’s needs.
With a digital adoption platform (DAP) like Whatfix, customer-facing teams can work with product managers to create contextual, in-app guided content that provides more intuitive user experiences and drives product adoption.
With a DAP like Whatfix, non-technical team members can create and publish:
- Product tours
- Onboarding task lists
- Step-by-step walkthroughs
- Smart tips
- Beacons and nudges
- Embedded self-help knowledge bases
- In-app surveys

Request a demo to see how Whatfix empowers organizations to improve end-user adoption and provide on-demand customer support


Thank you for subscribing!