Phillips ROI Model: The 5 Levels of Training Evaluation (2024)
All L&D teams want to build trust with their company’s different department leads and prove the ROI of their employee training courses.
If you can add a number – a monetary value – to your L&D program benefits, you will build trust with all teams much faster than you would without a number.
The Phillips ROI model takes results from various corporate training programs and answers the the question, “what’s the ROI from this program behind every dollar spent?”
It also produces a set of intangible benefits for evaluating and measuring training effectiveness. When L&D leaders use this new data, they strengthen their case and move past the training approval stage quickly.
In this article, we will go in-depth into the Phillips ROI methodology, how to calculate training ROI with it, and its advantages and disadvantages for L&D teams.
What is the Phillips ROI Methodology?
The Phillips ROI Model is a methodology and process for L&D and HR teams to tie the costs of training programs with their actual results. You may see this model also use the words “methodology”, “process”, and “model” interchangeably to describe the Phillips ROI Model.
Phillips ROI Model builds on the Kirkpatrick Model, which is one of the most commonly used models for corporate training evaluation. It classifies data from different types employee training programs to measure:
- the reaction of participants
- the actual learning of participants
- the behavior change from these learning
- the final result
But organizations that spend millions – or potentially billions – of dollars on training programs want more than results. To sanction large budgets, they need to see the monetary actual value of these programs – their return on investment (ROI).
The Phillips ROI Model makes the monetary benefit clear for organizations by adding a fifth layer to calculate the ROI of each program. This additional level compares learning business impact outcomes to total training costs.
The Phillips Methodology isolates the effects of the program from other influencing factors at all levels of the training program’s evaluation. This filtered data empowers L&D teams to derive accurate net monetary benefits from the various training program.
The Five Levels of the Phillips ROI Framework
The Kirkpatrick Model was the de-facto model of training evaluation in the 1970s and 1980s. With his book on training evaluation, Jack Phillips expanded on its shortcomings to include considerations for return on investment (ROI) of training programs.
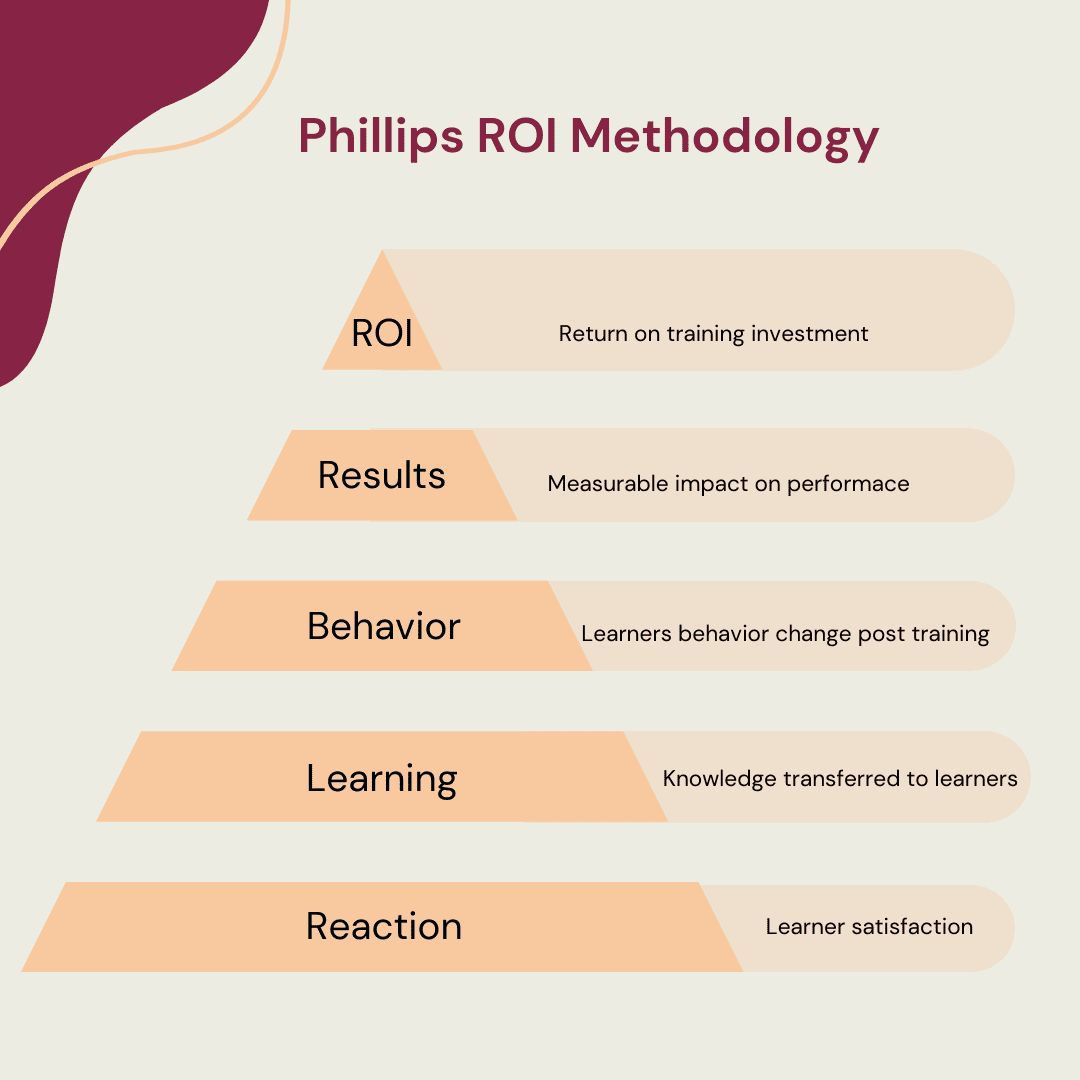
As discussed earlier, Phillips’ expanded approach of the Kirkpatrick Model to build the Phillips ROI Model. The ROI model of training evaluation that Jack Phillips proposed includes 5 steps:
- Reaction
- Learning
- Application and Implementation
- Impact
- Return on Investment
Level 1 – Reaction
At the first level in the Phillips ROI methodology, training managers use short surveys to gather data about participants’ reactions to their training. This step is not too different from the Kirkpatrick Model, but the data gathered here doesn’t offer too many direct benefits to the organization. Positive data on this level is an indicator of how cohesive is your L&D strategy is.
Level 2 – Learning
In this step, participants complete a multiple-choice questions (MCQs) survey or quizzes both before and after the training. Training managers interpret the responses to determine how much knowledge they’ve acquired. Once again, the Kirkpatrick Model evaluates learning the same way.
Level 3 – Application & Implementation
Unlike the Kirkpatrick Model, the Phillips Model doesn’t only collect data to find if the training worked or not. The new ROI-based model also evaluates the WHY behind the success/failure of the training.
When a program fails, the Kirkpatrick model data doesn’t tell organizations what went wrong, why it happened, and where it occurred. However, the Phillips Model adds qualitative feedback to the data process to help organizations improve their training programs. Training evaluation teams can thus understand what specific changes to the program will improve its output.
For example, let’s say 50 new recruits in the software developer pool receive training for a new programming language. If they pass level 2 (same for both models), we know they learned the language well. If their assignments don’t produce results due to faulty input data, the Kirkpatrick Model level 3 will only tell you that students failed them. Level 3 in the Phillips ROI model will also tell you the cause of these failures.
Level 4 – Impact
On level 4 of the Kirkpatrick Model, only the business results and impact is measured. The Phillips ROI model expands the focus of level 4 from unilateral results to multi-dimensional impact. The new model lets you analyze the impact of training content and other factors that contribute to participants’ final performance.
In the programming language training example above, the Phillips ROI model could analyze the impact of YouTube creators or other programming trainers on participants. Companies also use innovative techniques to measure training impact.
Level 5 – Return on Investment (ROI)
On the fifth level, the Phillips model uses cost-benefit analysis to map impact data to tangible monetary benefits and a set of intangible benefits. Training managers can use this data to measure and communicate the benefits of their program to other departments in the company and provide hard evidence to executives on the value of their training programs.

How to Calculate Training ROI with The Phillips Model
Throughout the first four levels of the Phillips ROI Methodology, data helps identify reasons for positive or negative ROI in the resulting fifth level. This model suggests that the final ROI of the training program is a result of a series of events:
- Transfer of knowledge and skills (in level 2)
- Application of learned knowledge and skills (in level 3)
- Business impact of training (in level 4)
Assuming the program clears level 1, each next level evaluated under the Phillips ROI Model checks if the change was a result of the program or various external factors.
To show the calculation of ROI under Jack Phillips’ model, let’s reiterate our previous example of 50 software developers receiving training on a new programming language.
Let’s put the use case through the Phillips ROI model and see how to calculate the ROI of this training program.
Consider these precautions before following the Phillips ROI Model for training evaluation
The Phillips Model presents a complex and sensitive process. Make sure the following conditions are met before you put the process to use:
- Conduct a needs assessment for your training program. Don’t use the ROI method when no needs assessment data is available.
- Include one or more strategies to isolate the training effect.
- Base the estimates only on the most reliable and credible sources.
- Calculate costs and benefits with a conservative approach.
- Don’t compare the training ROI with other financial returns until it’s absolutely essential.
- Don’t isolate the management from the ROI calculation process.
- Be cautious in deciding what’s measurable and what’s not. Take input from business teams on inclusion/exclusion of sensitive factors.
Step 1 – Gather data before the training starts
Before software developers start their training, they fill out a questionnaire to assess any trends over 6 months until the start. The questionnaire also examines their pre-training knowledge in concepts related to the new programming language. This will help understand how the training program helped different types of learners.
Step 2 – Gather data after the training ends
Post-program data comes from performance records of the company and/or through follow-up questionnaires of the following types:
- Participants fill questionnaires
- The company assesses their performance
- Subordinates, peers, and supervisors/seniors of participants fill in observational surveys
- Other relevant internal/external groups.
Collect this data for all levels of the model as required.
Step 3 – Isolate effects of lessons from the training program
The Kirkpatrick Model assumes improvements come from the training program. The Phillips ROI Model attempts to find other causes for training results including the training impact. Some of the possible factors that contribute to improved post-training performance include:
- Recent performance bonuses
- Competitive conditions in the company/department (for example, were there any impending promotions after the training program?)
- Any marketing/employer branding programs
- Any other seasonal/non-seasonal programs that offered incentives to participants
To isolate the effect of the training program, some techniques include:
- Trend line analysis
- Control groups
- Forecasting models
- Training impact estimation from participants, supervisors, experts, and customers.
Step 4 – Extract monetary benefits of the program from the data
After filtering the data and isolating training program effects, the monetary dimension lets us move one step closer to ROI.
In the example of training on a new programming language, we assume a profit of $5,800 per developer from the new project that employs 50 trained developers. This profit margin considers the effect of only the training program; overall profit figures may be higher due to other factors
Total profit from the training program = $5,800 / developer X 50 developers = $2,90,000.
Step 5 – Add up all program costs
This is a straightforward calculation that brings together all costs for the training program. The total program costs will be a summation of the following categories:
- Costs to design, develop, and administer the program (including payment to training staff and their travel, lodging, and miscellaneous expenses)
- Training venue costs
- Training material costs (physical paper, electronic hardware, training, and evaluation software, and other administration costs)
- Travel, lodging, meal, and miscellaneous costs of participants
- Salary of participants and their employee benefits for the time they will devote to training
- Other administrative costs incurred during the training program.
In the example of training on a new programming language, let’s assume the total program costs were $2,34,900.
Step 6 – Calculate the return on investment (ROI)
ROI (%) = (Net benefits of the training program / total program costs) X 100
= (($2,90,000 – $2,34,9000) / $2,34,900) X 100
= ($55,100 / $2,34,900) X 100 = 23.457%
Step 7 – Find the intangibles
A training program will have more than monetary benefits alone. Such intangible benefits are often more valuable than the hard data coming out of the ROI calculation process.
You can identify such abstract measures at any stage of the ROI calculation process through discussions with the project’s sponsors.
- during the needs assessment
- when you convert data into monetary values (step 4 in this section)
- in a separate follow-up evaluation.
Each type of program will have its own type of intangible benefits. The table below mentions the common categories.
| Benefits category | Relevant indicators |
| Customer service | Customer satisfaction surveys, customer complaints, customer response time. |
| Employee satisfaction | Attitude surveys, employee grievances, discrimination complaints, stress reduction, organizational commitment |
| Employee withdrawal | Employee churn, absenteeism, transfer, tardiness |
| Team effectiveness | Quick decisions, smooth communication, reduced conflicts, better cooperation |
Advantages of Using Phillips ROI Model for Training Evaluation
It’s best to compare the Phillips ROI model with the Kirkpatrick Model to bring out the advantages of the former.
1. Traces the complete chain of impact
According to the creator of the model Jack Phillips, the business impact observed in level 4 and the ROI calculated in level 5 are not independent. Data across all preceding levels affects the final ROI produced by the model.
A chain of impacts develops as participants gain skills and knowledge (level 2), apply them on the job (level 3), and generate business impact (level 4). So, measuring data across all levels helps evaluate the training program with high precision.
If level 5 produces positive ROI, data from past levels will show the specific impact of the training program without any other factors. Without this data, the success of the training program would only be guesswork.
Also, detailed data from the chain of impact allows debugging of the training program if level 5 produces a negative ROI figure. Training managers can pinpoint the exact reason for failure.
None of this is possible with the Kirkpatrick Model.
2. Measures intangibles
The Phillips ROI model accepts that you cannot measure certain outcomes in monetary value and the final ROI won’t represent such outcomes.
Outcomes such as customer satisfaction, employee satisfaction, and team bonding are hard to measure in numbers. Therefore, the Phillips Model measures such “soft” outcomes in addition to “hard” numerical outcomes.
The Kirkpatrick Model measures business impact in only numbers and does not consider intangible benefits during evaluation.
Disadvantages of Using Phillips ROI Model for Training Evaluation
While the Phillips Model is a significantly better way to evaluate training programs than the Kirkpatrick Model, it is not without its fair share of criticisms.
1. Late measurement of ROI
The ROI of a training program evaluated with the Phillips Model is not known until the training program is over. It would be impossible to make changes if we find out that the training program was a failed project after the project is over.
Jack and Patti Phillips address the problem of delayed ROI in their 2010 book “The Consultant’s Guide to Results-Driven Business Proposals: How to Write Proposals That Forecast Impact and ROI”.
This book presents strategies to help estimate ROI, determine goals, plan execution, and set a budget for a training program. These strategies help to predict training outcomes before the organization decides to make a large financial commitment.
2. Useful for only 5-10% of training programs
The Phillips Model provides more than enough data until level 4 to know how successful or unsuccessful a training program is. The ROI calculation in level 5 is good to know, but it’s not necessary in most cases.
According to Jack Phillips:
- All programs need level 1 evaluation
- About 90% of programs need level 2 evaluation
- About 30% of programs need level 3 evaluation
- 10-20% of programs need level 4 evaluation
- Only 5-10% of programs need level 5 evaluation
Various factors such as visibility of the training program, its goals, and its costs will decide if a level 5 study is necessary. Jack also remarks that these 5-10% of programs are usually the most expensive training programs with the largest audiences and an extraordinary amount of time and resources.
With the Phillips ROI model, you get precise data on how effective your training program is and how much profit it can generate. It also allows you to gauge intangible benefits arising from your training programs. Impact and ROI forecasting strategies can help you predict which profitable training programs to start and which unproductive ones to drop.

Boost training effectiveness with personalized onboarding and training, unlocking maximum ROI from your enterprise applications without raising training and support costs.