


Spending millions on product development doesn’t guarantee success. Up to 70% of software features remain unused by customers, and 78% of employees admit they lack the necessary expertise to utilize their daily tools effectively. That means the majority of your product investment may never translate into business outcomes.
For product leaders, this is the wake-up call: adoption is the real KPI. Without it, external products fail to retain customers, and internal tools never deliver promised efficiency. Adoption isn’t a side metric—it’s the difference between growth and wasted spend.
To get adoption right, you need the right signals. Vanity metrics like daily active users or NPS aren’t enough. You need to measure how quickly users reach value, whether they’re engaging with the features that matter, and where friction blocks them. These insights turn adoption into a discipline rather than a guess.
In this article, you’ll learn:
- Why adoption is the most important bridge between product investment and ROI
- The 15 product adoption metrics that actually show depth of usage, engagement, and value
- How to benchmark success and act on these signals
- How Whatfix empowers product leaders with in-app guidance and analytics to accelerate adoption
By the end, you’ll know how to measure adoption accurately, prove ROI to leadership, and ensure your product strategy is grounded in sustained user value.
The Importance of Tracking User Adoption
Measuring user adoption provides insights to help product owners understand if they’re enabling users to find value in digital applications. These benefits differ between user adoption strategies for customer-facing applications and internal enterprise software (like CRMs, ERPs, or HCMs). Let’s look at both below:
For Users of Customer-Facing Applications
High user adoption for customer-facing software contributes to key revenue, growth, and loyalty outcomes. When users consistently engage with a product, they’re more likely to:
- Achieve time-to-value faster and experience positive outcomes
- Stick around longer, increasing retention and reducing churn
- Engage with more features, increasing upsell/cross-sell potential
- Recommend the product to others, driving referrals and NPS
- Lower the burden on customer support through self-service behavior
- Improve Customer Lifetime Value (CLV) and satisfaction
For Internal Enterprise Software Users (i.e., Employees)
For internal tools, especially in enterprise settings, user adoption drives ROI by improving performance and operational agility. High adoption leads to:
- Higher workforce productivity and reduced manual processes
- Lower training and support costs due to intuitive usage
- Faster onboarding and shorter time-to-first action for employees
- Greater compliance with enterprise processes and policies
- Higher ROI on software spend and digital transformation initiatives
- Improved team member satisfaction and retention through better tools and overall employee experience.
20 User Adoption Metrics to Track
Tracking user adoption goes far beyond monitoring logins or surface-level usage. To fully understand how users experience your product—and where friction or drop-off occurs—product owners must analyze metrics across the entire lifecycle: from activation and engagement to satisfaction, retention, and business outcomes.
The following 20 metrics are grouped into five strategic categories to help you benchmark adoption, identify gaps, and optimize experiences that drive long-term success. Whether managing a customer-facing product or internal enterprise software, these KPIs will help you turn user behavior into actionable insights.
Adoption & Activation Metrics
- Product Adoption Rate: Measures how many users have adopted your product compared to the total number of intended users.
- Feature Adoption Rate: Tracks the percentage of users engaging with a specific feature post-release or enablement.
- Activation Rate: Indicates how many users complete the key action(s) that unlock the product’s core value (“aha!” moment).
Engagement & Behavior Metrics
- Daily Active Users (DAU) / Monthly Active Users (MAU): Measures active user count over time. A high DAU/MAU ratio signals strong habitual usage.
- Usage Frequency: How often users log in or engage with the product in a given time frame.
- Average Session Duration: Indicates how long users stay active during a typical session.
- Depth of Use: Tracks the number of features or modules a user engages with, showing how fully they’re exploring the product.
Satisfaction & Retention Metrics
- Net Promoter Score (NPS): Measures how likely users are to recommend your product to others.
- Customer or User Retention Rate: The percentage of active users over a defined period.
- Churn Rate: The percentage of users who stop using the product or cancel their accounts.
- Customer Satisfaction (CSAT) Score: A transactional metric capturing users’ satisfaction with a product, feature, or support interaction.
- User Feedback Volume & Sentiment: This tracks the quantity and tone of user feedback across surveys, tickets, in-app tools, or forums.
Onboarding & Time-to-Value Metrics
- Onboarding Completion Rate: Measures how many users complete guided onboarding flows or training modules.
- Time-to-First Action: Tracks how quickly users perform their first meaningful interaction post-sign-up.
- Time-to-Value (TTV): The time it takes for a user to experience value or reach a desired outcome.
- Time-to-Proficiency: Measures how long it takes an employee or user to become fully productive with a new app or workflow.
Business Impact & Productivity Metrics
- Employee Productivity Rate: Measures output at the individual level—e.g., tasks completed per day or hours saved using digital tools.
- Organizational Productivity Rate: Tracks output per employee across teams or departments, revealing macro-level efficiency gains from adoption.
- Process Cycle Time: Measures time to complete an entire business process end-to-end; shorter cycles signal improved operational efficiency due to successful adoption.
- Error Rate or Process Deviation Rate: Measures how frequently users make errors, deviate from SOPs, or require intervention to complete a task. A high error or deviation rate signals poor UI/UX, inadequate onboarding, or insufficient in-app support.
How to Measure Digital Adoption
Here are six steps to empower your organization to measure its level of digital adoption using a flywheel framework, which involves collecting adoption-related data to benchmark, test, and improve overall application engagement, usage, and adoption.
1. Invest in a digital adoption platform with analytic capabilities
If you’re dedicating enterprise resources to understanding your digital adoption, you should invest in a digital adoption platform with product analytics capabilities.
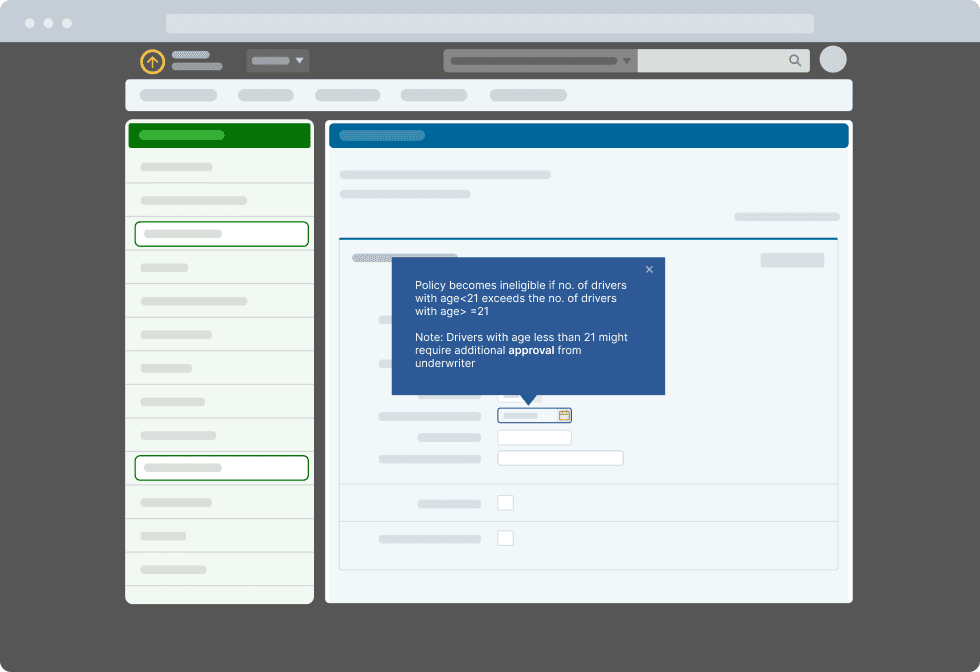
A digital adoption platform (DAP) is a no-code platform that overlays on top of your existing applications and digital processes, enabling you to create in-app guidance and on-demand help content directly within your applications. With Whatfix, create new user onboarding flows, task lists, tooltips, self-help wikis – all right in your applications.

For organizations seeking to measure digital adoption, DAPs like Whatfix offer powerful user behavior analytics and software usage tracking, providing valuable insights into engagement and adoption. These analytic features empower you with the data to understand the success of your onboarding flows and help content, identify friction areas, what processes or features need additional guidance, what type of users are adopting the platform, and more.

With these digital adoption analytic capabilities, you’re empowered to create more contextual, role-based training and support for your end-users through intelligent segmentation and user cohorts, helping you to drive overall adoption.
2. Benchmark your current rate of adoption
The next step in measuring and improving software adoption is to understand how your application users are currently engaging with and using their core software.
Start by identifying a few of your organization’s most critical software investments, such as your CRM, ERP, or HCM software. Document the number of seats you have for these tools, and integrate your DAP onto the applications.
You can start collecting data on how your end-users engage with and use these tools with a DAP’s analytic capabilities, which will empower you with data to start analyzing and understanding your baseline adoption level, providing you with a benchmark data point to improve upon.
With Whatfix’s digital adoption platform and product analytics suite, analyze, build, and deliver better end-user experiences to accelerate technology adoption and enable end-users to maximize software usage. Whatfix’s no-code system enables IT teams to analyze and measure digital adoption and product usage, create in-app guidance, and provide self-help user support. Analyze user adoption, map journeys and flows, build user cohorts, and identify areas of friction.
3. Collect and analyze quantitative end-user behavior data, as well as qualitative user feedback data
To fully understand the “why” behind low user adoption, you’ll need to collect both quantitative end-user data and qualitative data, such as employee feedback.
This will provide nuanced insights from different roles and end-users on what is preventing them from adopting a platform, what they find useful, where they struggle, and what they need to support them.
With a DAP like Whatfix, organizations can collect feedback in real-time, without leaving their applications. This feedback can be simple NPS surveys, or detailed open-form survey questions, such as feedback on certain in-app guidance, what users are struggling with, and more.

4. Set adoption goals aligned to your business outcomes
Once you have benchmarked your digital adoption rate and analyzed your end-user behavior data and feedback, you’re ready to start making data-driven, actionable digital adoption goals and recommendations.
We recommend tracking various KPIs to track that all influence your digital adoption rate, such as:
- Number of daily active users (DAUs), weekly active users (WAUs), and monthly active users (MAUs).
- Frequency of usage.
- Onboarding completion rate.
- Help content consumed.
- Tasks failed.
- Dropoff points.
- Goal completion rate.
5. Take data-driven action by building and testing new in-app guidance and other product adoption experiences
Now that you have created goals based on the user insights you’ve analyzed, you can start taking action by creating new in-app guidance and help content designed to support your end users and help them realize a product’s full value.
With Whatfix, organizations can create in-app guidance with a no-code editor. This allows non-technical team members to develop in-app alerts, pop-ups, task lists, tooltips, feature walkthroughs, and more—all tailored to their adoption goals and needs.
With Whatfix’s cohort and segmentation features, you can also build contextual, role-based experiences and user flows targeting your different end-users, providing highly relevant information to drive adoption.
6. Analyze the impact on adoption and test again
Your digital adoption journey is never “finished”. New technology will be implemented, changes to existing processes will happen, and certain employees will always need a little extra support.
Think of your digital adoption journey as a flywheel. You collected data, analyzed it, set goals, and launched tests and changes to improve it. From there, you start the process all over again by examining the impact your changes made to your digital adoption and the various KPIs and metrics relevant to your business’s adoption journey.
Best Practices for Improving User Adoption
Tracking user adoption metrics is only the first step. To translate data into impact, product owners must benchmark current performance, analyze usage trends, and run iterative experiments that improve the overall user experience. Whether you’re supporting new feature launches, driving employee onboarding, or improving self-service behavior, the following best practices can help you operationalize adoption analytics for measurable results:
- Define clear adoption goals and success criteria: Align your product, UX, and business teams on what success looks like (i.e., feature usage, process completion, or productivity outcomes) before selecting metrics.
- Instrument key user journeys: Use product analytics tools (like Whatfix Product Analytics) to track actions across the user lifecycle, from first login to advanced feature usage.
- Segment your users: Analyze metrics by cohort (e.g., new users vs. power users, departments, roles) to identify patterns, drop-off points, and opportunities for targeted interventions.
- Benchmark against past performance and industry standards: Establish internal baselines, then compare performance across periods, teams, or similar tools in your tech stack. Use public benchmarks cautiously, but directionally, to gauge performance.
- Pair quantitative data with qualitative insights: Combine usage metrics with user interviews, surveys, and support feedback to understand the “why” behind behavior and friction.
- Track onboarding and training effectiveness: Measure onboarding completion, time-to-value, and time-to-proficiency to assess how quickly users ramp up and whether your enablement is effective.
- Monitor and reduce user friction points: High error rates, low feature engagement, or abandoned workflows should trigger product improvements or in-app guidance interventions.
- Test improvements through A/B or multivariate experiments: Run controlled experiments—such as changing UI elements, adjusting workflows, or deploying new Smart Tips or Flows—to test the impact on adoption KPIs.
- Automate adoption reporting for key stakeholders: Set up dashboards and alerts so product managers, IT leaders, and success teams can quickly monitor real-time adoption trends and course-correct.
- Tie adoption metrics to business outcomes: Connect usage metrics with broader KPIs like team member productivity, customer retention, compliance adherence, or cost reduction to justify investment and prioritize initiatives.
Take a Data-Driven Approach to User Adoption With Whatfix
Driving meaningful user adoption doesn’t stop at tracking metrics; it requires the ability to act on them in real time. That’s where Whatfix bridges the gap between insight and impact. With Whatfix Product Analytics, product owners and application leaders gain deep visibility into how users interact with applications, which features they engage with, where they drop off, and how workflows perform across different user segments.

Once you’ve identified areas of friction or underutilization, Whatfix DAP empowers you to take immediate, targeted action. You can deploy contextual in-app guidance (like Flows, Smart Tips, Task Lists, and Pop-Ups) tailored to each user’s role, behavior, or stage in the journey. This eliminates confusion, accelerates onboarding, and proactively supports users as they navigate complex processes.

To continuously improve adoption, Whatfix also enables you to collect in-the-moment user feedback, measure onboarding completion rates, and track time-to-proficiency. Product owners can refine their UX and enablement strategies by combining behavior data with user sentiment to deliver ongoing value.
Ultimately, Whatfix turns user adoption into a continuous improvement system, where every insight is actionable, every interaction is personalized, and every user has the support they need to succeed. Whether you’re managing a customer-facing product or driving transformation across your internal tech stack, adoption clicks better with Whatfix.