


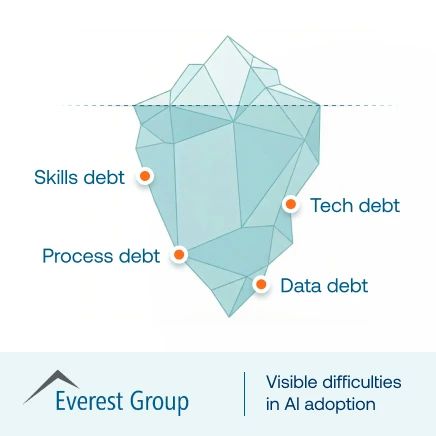


When you launch a new feature and see just ~24.5 % activation across your user base, you’d be wise to pause and ask: What went wrong?
That statistic is the industry average core feature adoption rate—and it reveals a harsh truth: many product investments never reach users’ workflows.
In 2026, product and engineering teams still wrestle with this reality: investing in features that users ignore. That’s wasted R&D, delayed ROI, plus mounting pressure from leadership to show impact. You can’t afford to treat feature rollout as a checkbox.
To change that, you need a deliberate path: from awareness → first use → habitual engagement. That means coordinating announcements, surfacing features at the right moment with in-app guidance, and tracking usage data to continuously optimize. Push too hard and overwhelm users. Do too little and features fade into oblivion.
In this article, you’ll get:
- A clear, battle-tested feature adoption framework you can anchor your strategy on
- Best practices to increase awareness, drive activation, and reduce churn
- The metrics you must monitor to validate whether a feature is truly “adopted”
- A look at how Whatfix empowers product teams with embedded guidance + analytics to shorten the gap between release and value
By the end, you’ll be able to defend your feature rollouts with data, align cross-functional teams on adoption goals, and execute in a way that drives real, tangible usage.
What Is Feature Adoption?
Feature adoption involves introducing new or existing features to customers and users, encouraging them to engage, activate, and use them, and providing support documentation on how to use them in their daily lives to showcase a feature’s full value.
The Feature Adoption Funnel
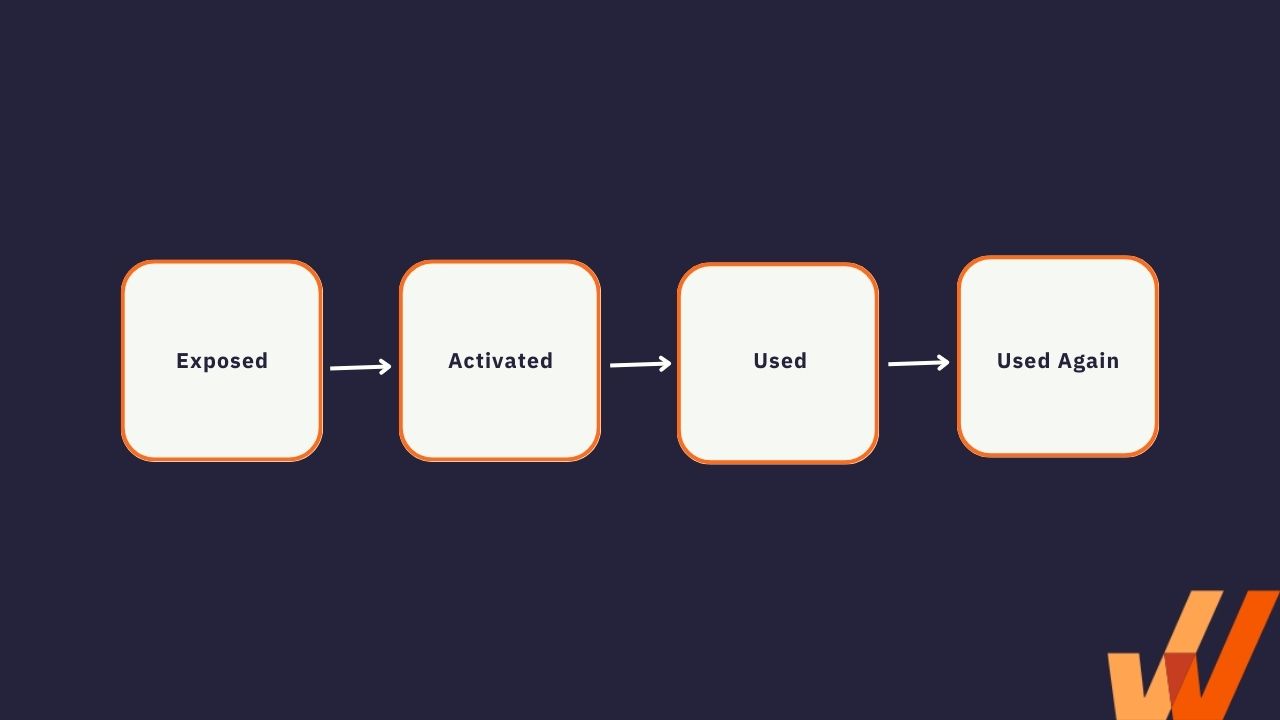
Users go through a process from the moment they first encounter a feature, begin exploring it, and eventually use it consistently. These steps include:
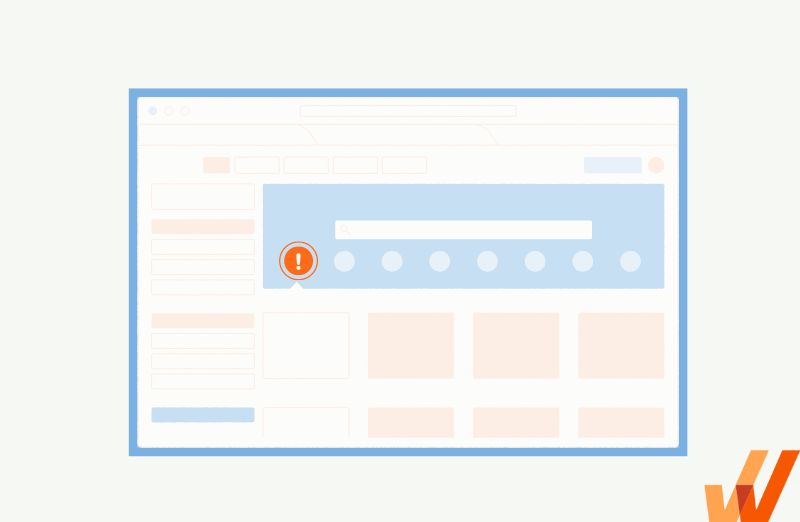
- Exposed: This is the stage where a user is first introduced to a feature. They become aware of it either by exploring on their own or through onboarding cues such as guided tours, pop-ups, and alerts.
- Activated: The activated stage is where a user takes the first step towards using a feature, such as importing their data or inviting their team members.
- Used: At this stage, a user has tried out a feature for the first time to see how it works. This point is ideal for follow-ups, and here’s where you can suggest a conversation with your product experts or offer users discounts and product credits to help them get started.
- Used Again: This is the final stage of the feature adoption funnel, where a user tries out a feature again to better understand how it works or to make it part of their workflow.
Let’s look at an example to give more context to this feature adoption funnel.
In this example, you start with a user cohort of 2,000 new users who signed up for your product in March, and you want to understand feature adoption for this segment of users.
Out of those 2,000 users, 800 clicked on an in-app pop-up that led them to a walkthrough of the specific feature you’re analyzing. Your feature’s exposure rate is 40%.
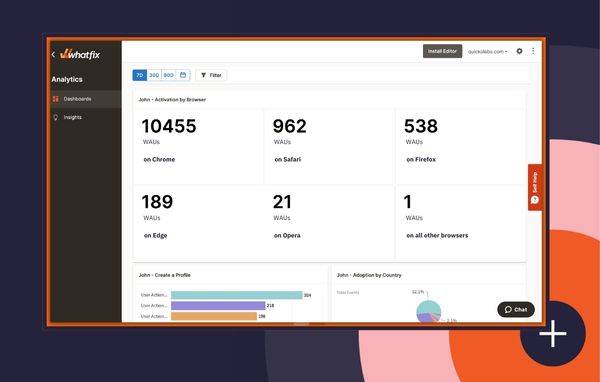
Using Whatfix Analytics, you see that out of the 800 users exposed to a specific feature, 700 activated the feature—i.e., they set up a dashboard, imported data, invited a co-worker, or met specific criteria your team has set for achieving your “activation” goal. This means that your activation rate for your March new user cohort is 35% (700 / 2,000), and your exposure-to-activation rate is 87.5% (700 / 800).
Next, you want to see how many users who activated the feature actually used it. For simple features, “activation” and “used” may be the same. For more complex features, tasks, and workflows, you’ll need to create the criteria for accomplishing the “used” goal. For the sake of this example, let’s say that 400 users who activated the feature used it. That means your overall feature used rate is 20% (400 / 2,000) and your activation-to-used rate is 57% (400 / 700).
Finally, you want to measure repeat feature usage to determine your “used again” rate. The used again metric is extremely important to overall product stickiness and overall user adoption. This shows that users are returning to use the feature multiple times, understand how to use it, and have realized value from implementing it into their workflows. For this example, let’s say that 200 users used the feature one or more times, which means your overall “used again” rate is 10% (200 / 2000) and your used-to-used again rate is 50% (200 / 400).
You can see the complete feature adoption funnel analysis data in the table below:
| March new user cohort | (2,000 users – 100%) |
| Exposed | 800 users exposed to the new feature, a 40% (800/2,000) “exposure rate”. |
| Activated | 700 users activated the feature. This is an 87.5% (700/800) “exposure-to-activation” rate and a 35% (700/2,000) “overall activation rate” for the new feature. |
| Used | 400 users used the new feature. This is a 57% (400/700) “activated-to-used” rate and a 20% (400/2,000) “overall used rate” across its userbase for the new feature. |
| Used Again | 200 users used the new feature multiple times. This equals a 50% (200/400) “used-to-used again” rate and a 10% (100/2,000) “overall used again rate” for the new feature across all users. |
Throughout the feature adoption process, you need to keep your time-to-value short by simplifying your product’s UI and using a straightforward onboarding experience to determine how users can get started with your product quickly.
Feature Adoption vs. Feature Discovery
On the surface, they seem quite similar. However, feature discovery and feature adoption are two different approaches to your product adoption strategy.
- Feature discovery is the process of making users aware of new or underused features, while adoption only ensues when your users start trying out these features.
- Feature adoption includes all the effort a product team makes to put their product’s features in front of their users, eventually leading to feature adoption.
The Importance of Feature Adoption
Overall adoption is the big-picture goal of product management teams, but feature adoption is the path to that goal—you need to encourage users to try out your product’s functionality, find it helpful, and slowly expand their usage.
1. Feature adoption drives renewals, retention, and upsells
Your users are more likely to stick around when they find and start using features that solve their pain points, fit into their workflows, and integrate with the rest of the tools they use.
2. Drives overall product adoption and stickiness
Marketers and growth engineers obsess so much about acquiring new users, signups, and free trials that they forget they’re essentially vanity metrics—the signal-to-noise ratio is relatively poor, and a significant number of the new users you bring into the door will churn without trying out your product enough to see what it offers.
Instead, feature adoption offers an alternative to a blind focus on vanity metrics.
Why? When users try out specific features and use them long enough to get value out of them, they’re more likely to stick with your product, make it part of their workflow, and eventually explore other features that may be tangential to their desired use case.
3. Empowers product teams to capture and analyze user behavior data and feedback
Feature adoption serves as a rich source of behavior analytics and insights that help product teams understand their users’ usage patterns, see which features they engage with the most, and then figure out how to optimize the entire product’s UX to fit their customers’ needs. This feature engagement data provides valuable insights to the product team on the value of features and provides direction for future product development.
Feature Adoption Metrics to Track
Feature adoption metrics measure specific data points that show your customers’ sentiment toward your product. They help you monitor your growth efforts without frequently referring to your spreadsheets.
Here are feature-specific adoption KPIs and metrics to capture, benchmark, track, and improve on:
- Overall feature adoption rate: Feature adoption rate refers to the percentage of active users who use a particular functionality in your product. To calculate your feature adoption rate, divide the monthly active users who tried out the feature in question by the total number of logins or active users during the same duration.
- Feature adoption by user cohort or segment: This is quite similar to the aforementioned, but in this case, it refers to the percentage of a specific batch of users who started using a particular feature. You can segment users in a variety of ways, based on the acquisition date, pricing tier, company size, user persona, or any other metric you can extract from your database.
- Exposed rate: The number of users who have been exposed to a new feature. For example, how many users saw a pop-up promoting a new feature?
- Activation rate: The number of users who have met the criteria for activating a feature. This typically means they have gone through a feature introduction and walkthrough, and have started to engage with that feature. Examples include importing data or creating a dashboard.
- Used rate: The number of users who have met the criteria for “using” a feature. “Activation” and “used” may be the same for simple products, but differ for more complex features and workflows.
- Used again rate: The number of users who have met the “used” criteria more than once for a specific feature.
- Frequency of feature use: While it’s important that users initially engage with a new feature, it doesn’t matter if they fail to use it in their daily lives. This metric expands on the overall feature adoption rate and answers the question, “How often is a feature being used?”
- Time-to-first use: Time-to-first use measures how long it takes a user to try out a feature for the first time after signing up. This metric is important for understanding what features are being adopted first, which are seen as more critical by users, and so forth.
- Time-to-adoption rate: Time-to-adopt measures how long it takes your customers to start using specific features after they sign up and complete your product onboarding. This metric will explore the relationship between your user onboarding flows and individual feature adoption success.
How to Increase Feature Adoption
While feature adoption may not seem simple, there is a blueprint: observe how your users currently use your product, learn what they expect instead, and then close that expectation-reality gap as un-chaotically as possible with in-app guidance and help support. You can repeat this cycle by using a product analytics tool to experiment and make data-driven product tweaks.
1. Build features that solve user problems
It’s a simple problem, but many products seem to run into this issue.
No amount of growth gimmicks, onboarding tricks, or conversion tactics can help a bad or underwhelming product. It may generate enough growth to keep your product team working on it, but users fail to stick around, with high churn and low NPS.
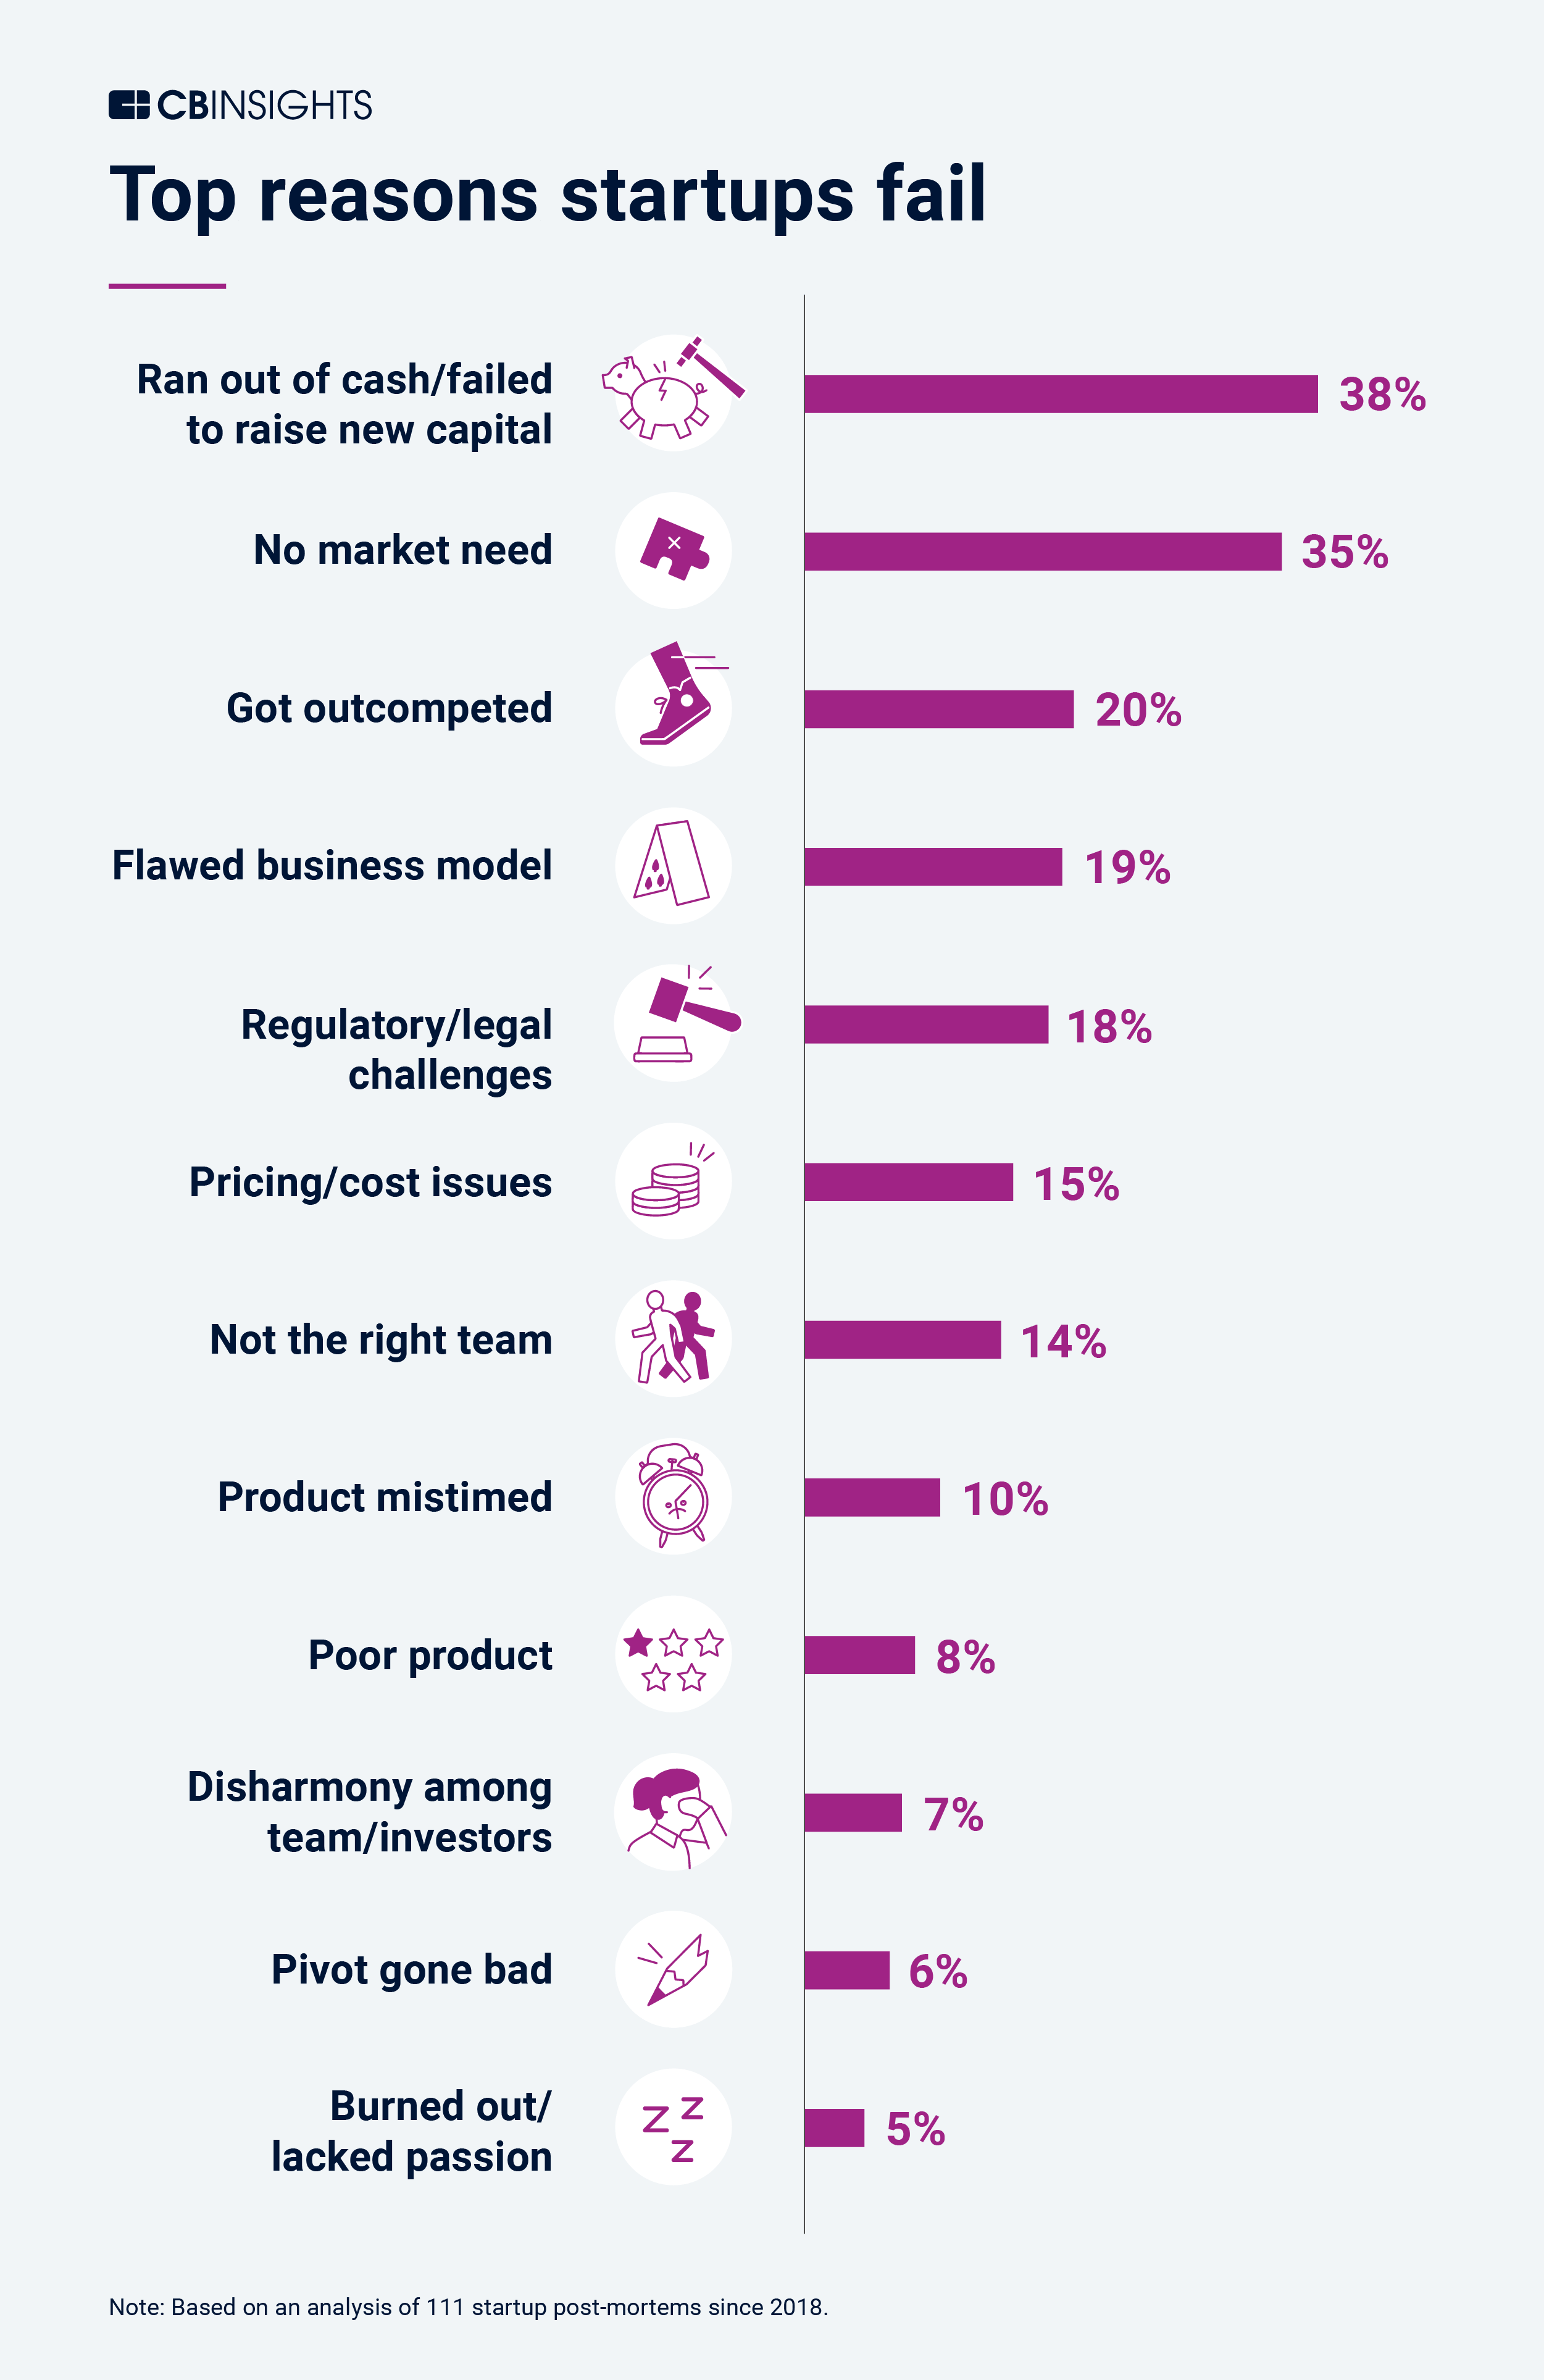
According to CB Insights, poor product-market fit is the second-biggest (35%) reason startups fail—surpassed only by running out of money. Your development process needs to be tied directly to product feedback to ensure you’re investing your engineering and marketing resources in building features that solve your users’ pain points and that (not surprisingly) they’re willing to use and pay for.
2. Launch an omnichannel new feature announcement plan
To maximize adoption, your feature announcement plan should reach customers, employees, and end-users across multiple touchpoints. By layering different communication channels, you ensure that your message connects with audiences where they are most likely to notice and act. Here’s a comprehensive list of ways to announce new features:
- In-App Communication: Reach users directly inside your product with tours, walkthroughs, Pop-Ups, tooltips, banners, Task Lists, and Flows to guide them through new functionality.
- Website Announcements: Use homepage banners, login/logout screens, or dedicated landing pages to spotlight the feature to both users and prospects.
- Blog Posts: Publish detailed articles that explain the feature’s value proposition and benefits, while also driving organic search visibility.
- Change log & Product Updates Hub: Provide clear documentation of changes and updates, often through a recurring “What’s New” section or product updates page.
- Email Campaigns: Send targeted announcements or newsletters to customer segments, linking to tutorials, blog posts, or support articles for deeper learning.
- Social Media Posts: Create platform-specific messaging, visuals, and short videos to generate awareness among both users and potential customers.
- Video Tutorials & Webinars: Produce quick explainer videos or host live webinars that visually demonstrate how the feature works.
- Customer Success & Account Manager Outreach: Train CSMs and AEs to proactively discuss the feature in meetings, QBRs, and 1:1 conversations with key accounts.
- Knowledge Base & Help Center Updates: Add step-by-step guides, FAQs, and visual aids so users can self-serve when exploring the new functionality.
- Community Forums & User Groups: Post announcements, gather feedback, and encourage peer-to-peer discussions in customer communities.
- Press Releases & PR Coverage: For major launches, issue formal announcements to generate industry buzz and third-party validation.
- Sales Enablement Materials: Update pitch decks, collateral, and training for your sales team so they can position the new feature effectively with prospects.
- Product Tours at Login or Onboarding: Highlight features during login flows or onboarding experiences to capture user attention early.
- Push Notifications & Mobile Alerts: Use mobile push notifications or app alerts to remind users of new features at appropriate times.
- In-Product Surveys & Feedback Loops: Collect user reactions and insights immediately after announcing the feature to track adoption and refine your approach.
Whatfix provides an all-in-one platform to empower teams to not only announce new features, but also track and improve overall adoption. With Whatfix, product managers and application owners can:
- Use no-code Pop-Ups to alert users about new features directly inside the app.
- Create step-by-step in-app guidance with Flows, Smart Tips, and Task Lists that walk users through the new functionality in real time.
- Link release notes, help articles, and tutorials to Self Help so users can instantly access supporting documentation.
- Track user engagement with in-app announcements and guidance to understand which users interact with new features.
- Benchmark overall feature usage across your organization to measure adoption and identify where additional enablement is needed.
This approach ensures that every new feature rollout is supported by contextual guidance, just-in-time resources, and measurable adoption metrics—all delivered seamlessly within the applications employees already use.
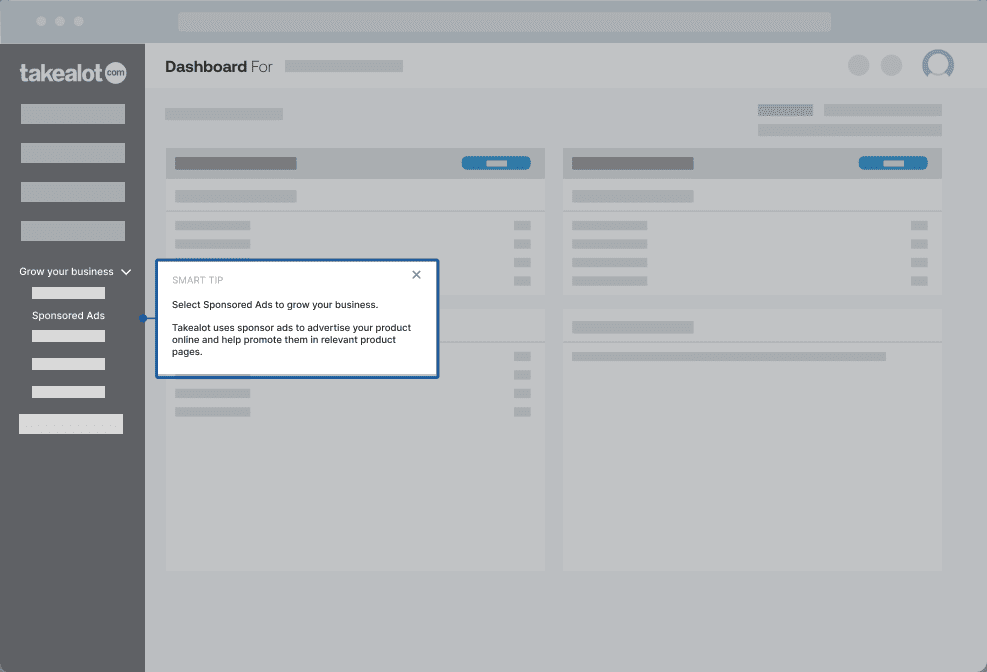
Takealot, South Africa’s largest eMarketplace, uses Whatfix to accelerate the adoption of new and advanced features such as sponsored ads and marketplace analytics. By embedding Whatfix guidance into its seller platform, Takealot automates self-training, reduces onboarding friction, and ensures its sellers quickly gain value from new tools. This enabled Takealot to scale new feature adoption across thousands of sellers while minimizing manual training.
3. Take a phased approach to new feature adoption with guided experiences
Driving adoption of new features shouldn’t be a one-time announcement. Complex or advanced functionality often requires a phased rollout where users are introduced to capabilities gradually, with the proper guidance at the right moment. This prevents overwhelming users and nudges them toward adoption as they reach points in their workflow where the feature delivers immediate value.
By layering contextual nudges, organizations can surface underused features exactly when they are most relevant. This approach is compelling for features that require new workflows or a mindset shift. Rather than forcing usage upfront, you allow employees to discover value naturally. The result is deeper engagement and longer-term adoption rather than shallow one-time usage.
With Whatfix DAP, product managers and application owners can design this phased experience directly within the application using a range of in-app guidance options:
- Product Tours: Guide users through a new feature step by step on first exposure.
- Interactive Walkthroughs: Provide task-driven assistance that adapts to user actions.
- Smart Tips: Surface contextual tooltips that explain functionality in real time.
- Beacons: Visually draw attention to new or underused features.
- Self Help: Give users on-demand access to documentation, release notes, and tutorials from inside the app.
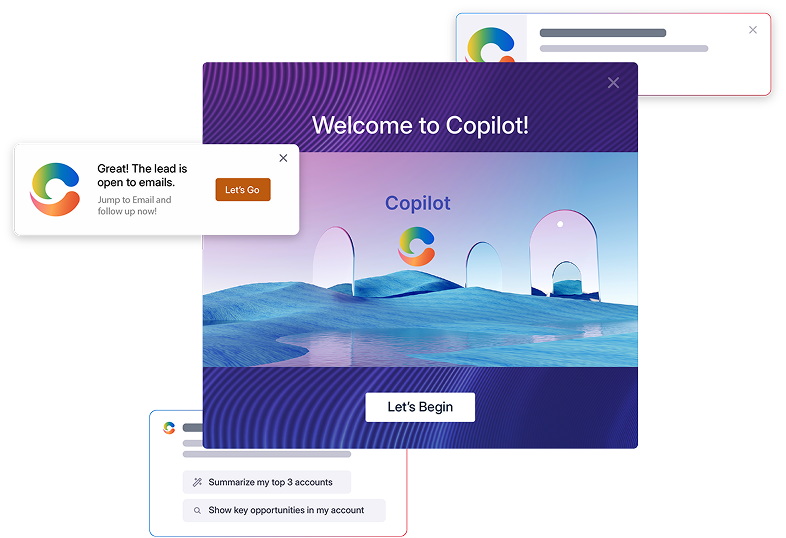
Microsoft Partners With Whatfix to Drive Copilot Adoption: To drive Copilot adoption within Microsoft Dynamics 365 Sales for its MSX (enterprise sales experience) team, Microsoft embedded in-app guidance that introduced AI-driven capabilities incrementally. Sales users were nudged with contextual prompts, walkthroughs, and tooltips that surfaced Copilot at the exact points in the sales process where it could save time and enhance productivity. This reduced resistance to change, allowed sellers to explore advanced AI features at their own pace, and ensured sustained adoption across a global enterprise team.
4. Build user cohorts and target each segment with contextual experiences
Not every customer or end-user needs to be alerted for every feature launch. Over-communicating risks can overwhelm users, while under-communicating can cause missed opportunities. The key is segmentation—building user cohorts ensures that only the right people see the right announcements at the right time.
For instance, if your product rolls out a compliance-related feature, the announcement should be directed toward customers in regulated industries where compliance is a critical concern. In another scenario, if your CRM integrates an AI assistant such as Microsoft Copilot or Salesforce Agentforce, guidance should be contextualized by role. Marketers may see prompts tied to campaign analytics, AEs may receive guidance on sales playbooks, CSMs can be shown customer insights, and support agents can be directed to resolution recommendations. By targeting messaging at the role or industry level, you cut noise, boost relevance, and accelerate meaningful adoption.
Whatfix makes this process seamless by combining real-time user cohorts with its in-app guidance. With Product Analytics, you can create dynamic user segments based on behavior as it happens, not static, one-time groups. These real-time cohorts can then be paired with Whatfix Guidance Agents (AI-powered in-app assistants) to:
- Deliver role-based onboarding experiences.
- Contextualize in-app guidance around the workflows users care about most.
- Proactively engage at-risk users before they churn.
- Accelerate time-to-value, improve retention, and guide users to adopt underused features.
This segmentation and contextual delivery blend ensures that adoption strategies are personalized, adaptive, and directly tied to user needs and behaviors.
5. Track user engagement, benchmark new feature usage, and iterate
Measuring adoption is more than tracking whether users log in or click on a feature—it’s about understanding how they interact with your in-app guidance and the feature itself, then translating that into actionable insights. With Whatfix, enterprises can track adoption across both levels: Guidance Analytics for in-app content performance and Product Analytics for behavioral and event-level insights.
Guidance Analytics is built into the Whatfix DAP to track usage and success rates of in-app experiences like Product Tours, Walkthroughs, Smart Tips, and Self Help. Application owners can see which content drives engagement, how far users progress in walkthroughs, and which announcements resonate most. This clearly shows how practical in-app guidance is at nudging users toward adoption.
Product Analytics takes this a step further, uncovering why users behave as they do. With real-time autocapture and no-code event tracking, every interaction is automatically logged, letting product teams build funnels and user journeys without engineering dependencies. Session Replays provide visual context, showing where users succeed or drop off. AI-powered Insights Agents then interpret the data, surfacing patterns, explaining friction points, and recommending the best actions to accelerate adoption.
Key capabilities of Whatfix Product Analytics include:
- Autocapture & No-Code Event Tracking: Instantly log every user action and create funnels to measure workflow success and drop-offs.
- Session Replays: See user journeys as they happen to diagnose problems quickly and improve experiences.
- AI-Powered Insights: Get plain-language explanations of user behavior, friction points, and adoption challenges with prioritized recommendations.
- Dynamic Cohorts: Create real-time user segments and pair them with Guidance Agents to deliver contextual in-app experiences that improve retention and accelerate time-to-value.
- In-App Surveys: Collect qualitative feedback and analyze it automatically to uncover why users act as they do.
This unified approach enables product managers and application owners to benchmark adoption, identify where friction occurs, pinpoint “aha!” moments when users realize value, and continuously iterate on their adoption strategy. Whatfix empowers teams to transform feature launches into long-term business outcomes by combining guidance engagement data with deeper product analytics.
7 Examples of New Feature Announcements
Now that we’ve discussed some of the best practices for planning your feature launch and communicating it widely, it’s time to get inspired by some great examples.
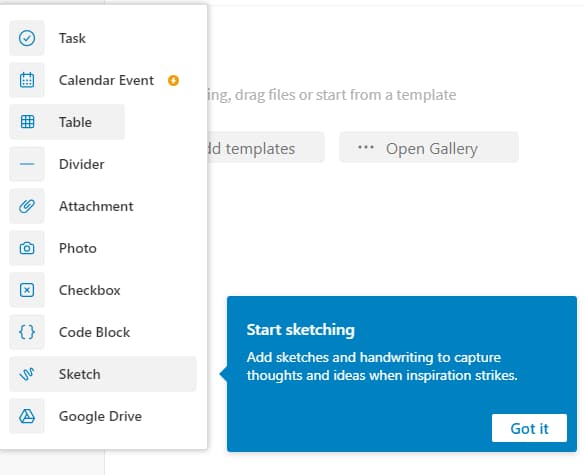
1. Evernote utilizes in-app guidance to highlight new features inside its app
Evernote does impressive work highlighting new features inside the app itself, capturing users’ attention with in-app notifications. One example is the task list in its sidebar (we call these Task Lists here at Whatfix!)
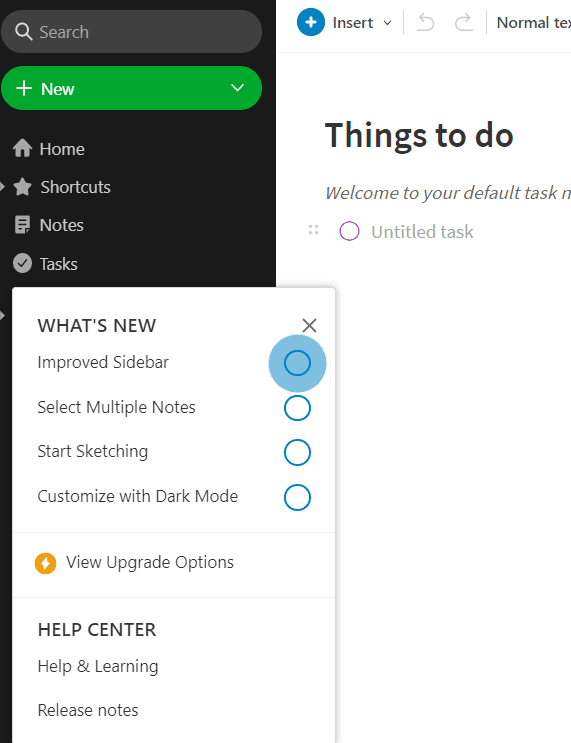
When users click on a new feature, they’re taken on a step-by-step, interactive walkthrough of its newly launched features – helping users reach their aha! moment. To continue driving adoption of its new features, Evernote then provides in-app support with embedded release notes.
2. Offlight embeds its product update release notes in an in-app pop-up
Offlight is a personal task planning web app still in its early stages. Since the product is relatively new, the team is consistently rolling out new features, product updates, and performance improvements, pushing updates every week.
Its product team reaches its users directly inside its app by creating a pop-up triggered upon opening its web app. They embed all significant updates and new features directly inside this pop-up, which includes an overview of each new feature, a GIF or video of the update, and links for more in-depth documentation.
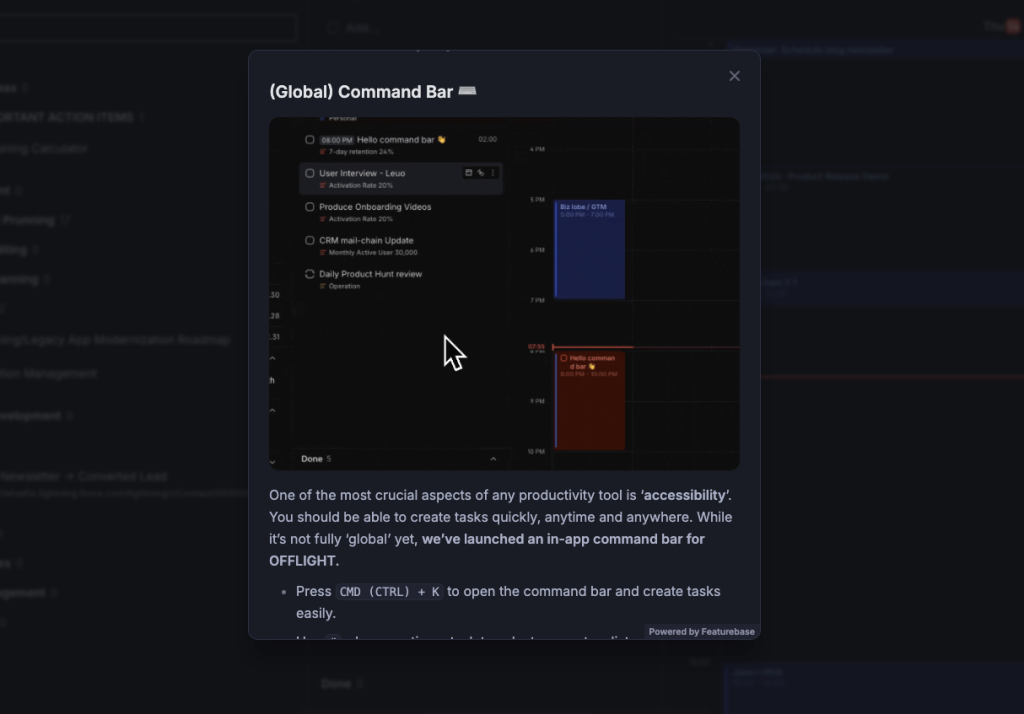
The in-app message is effective upon opening the platform because it catches users when they’re about to get some work done and when they’ve already dedicated some time to utilizing your product.
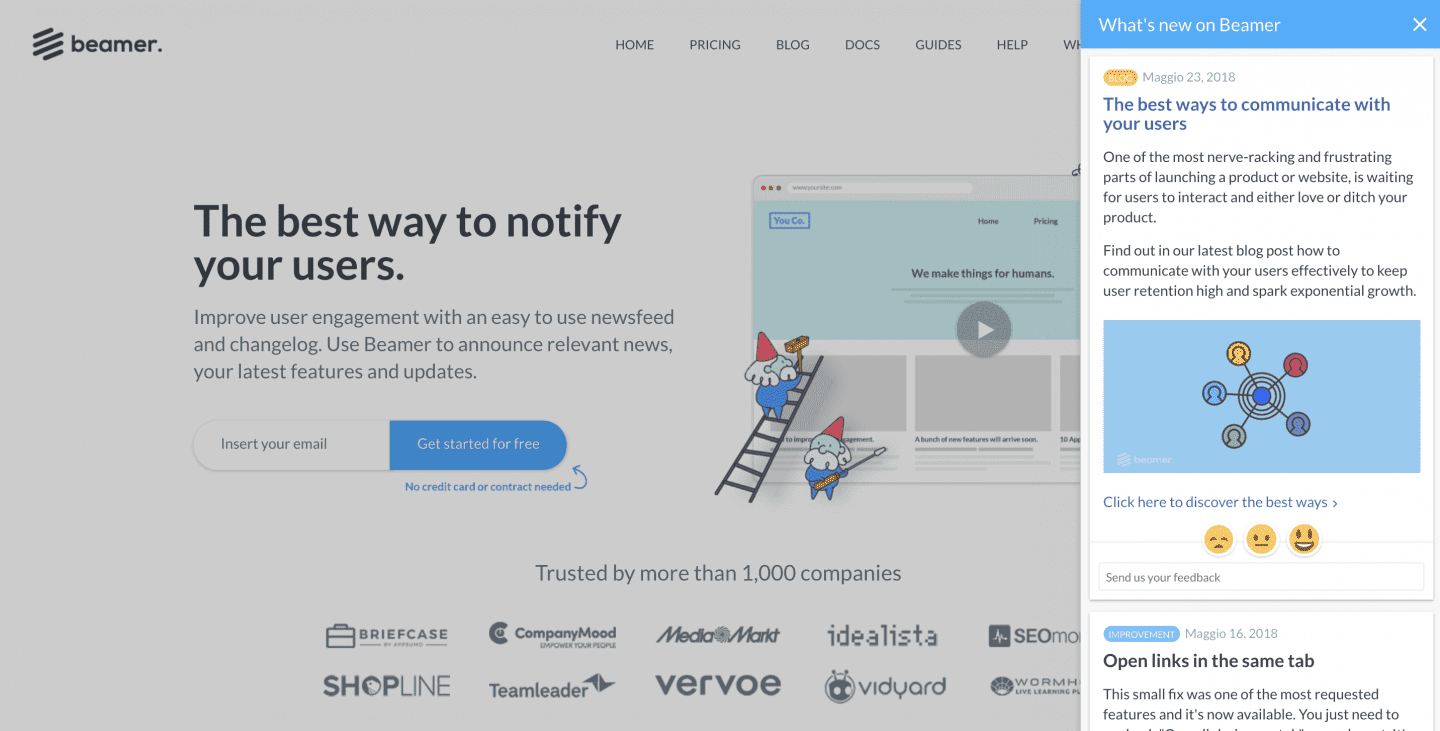
3. Beamer uses its website’s live chat to promote new features
Beamer drives awareness of its newly launched features by utilizing its live chat to present what’s new. There is a directly embedded overview of its product updates and a link to learn more.
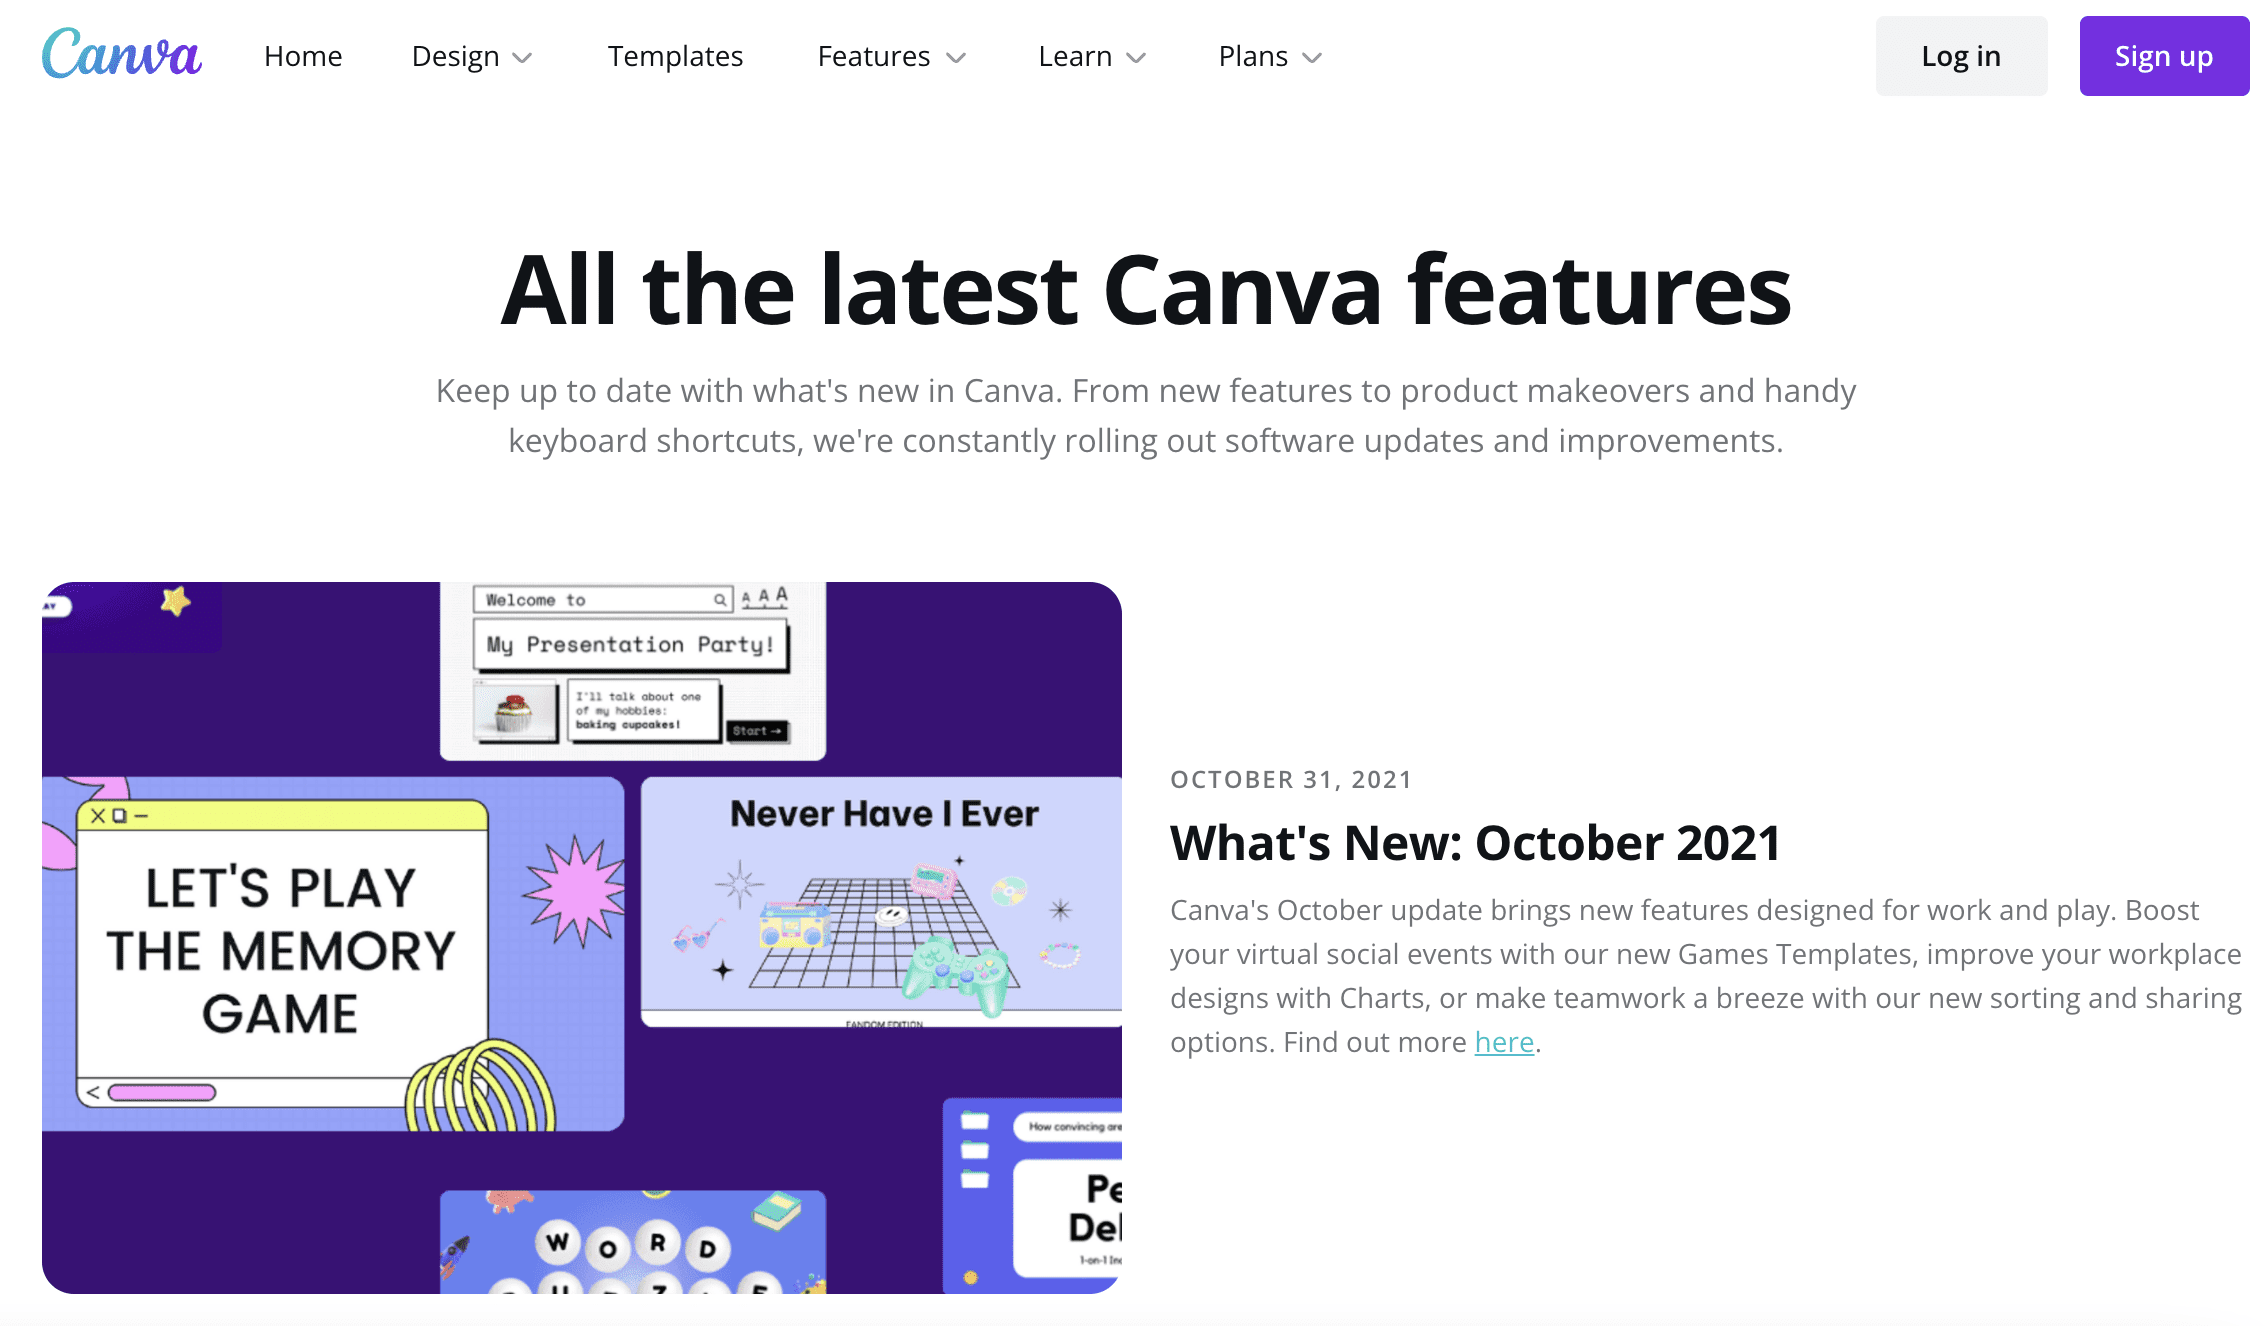
4. Canva announces new features in engaging blog posts
Canva does a great job of keeping customers and potential customers informed about new features using its blog. Each post includes product screenshots and an opportunity to enroll in its newsletter to receive future updates. The posts detail the new features, where to find them, and potential use cases for each update.
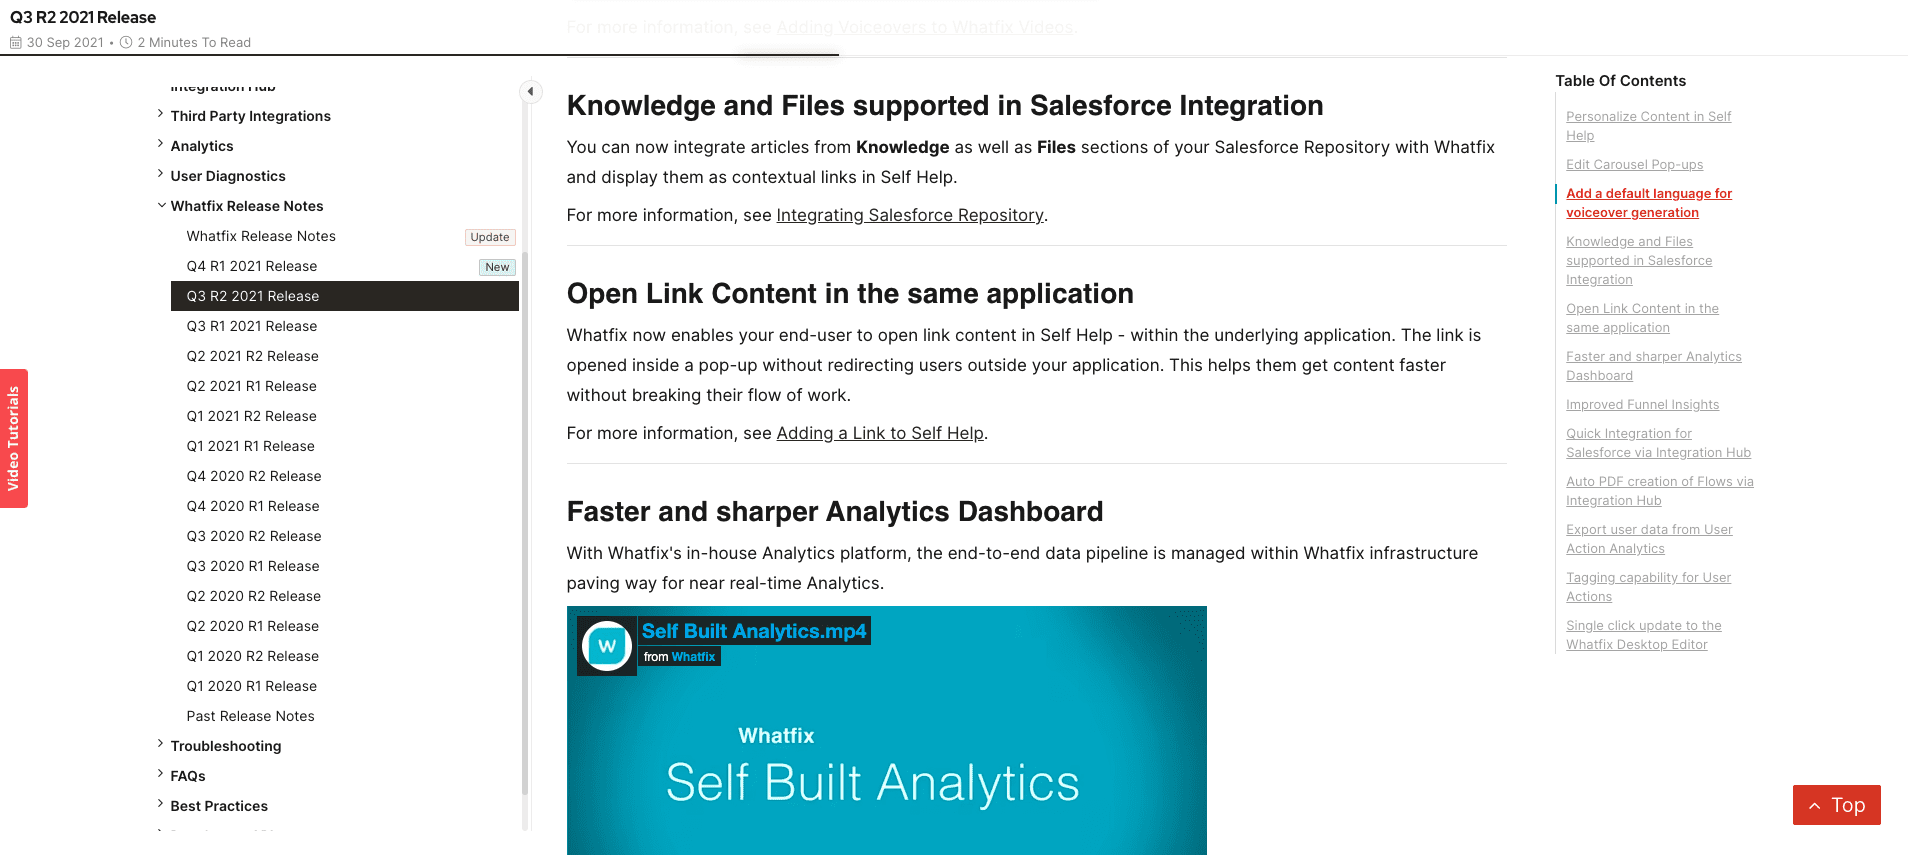
5. Whatfix publishes quarterly release notes to keep customers updated
Here at Whatfix, our product marketing team writes and publishes quarterly release notes available in our support community, where users can engage and ask questions. Our community is where many of our power users – and new users looking to learn more – find information so it’s a good place for us to reach a wide variety of people with our product updates.
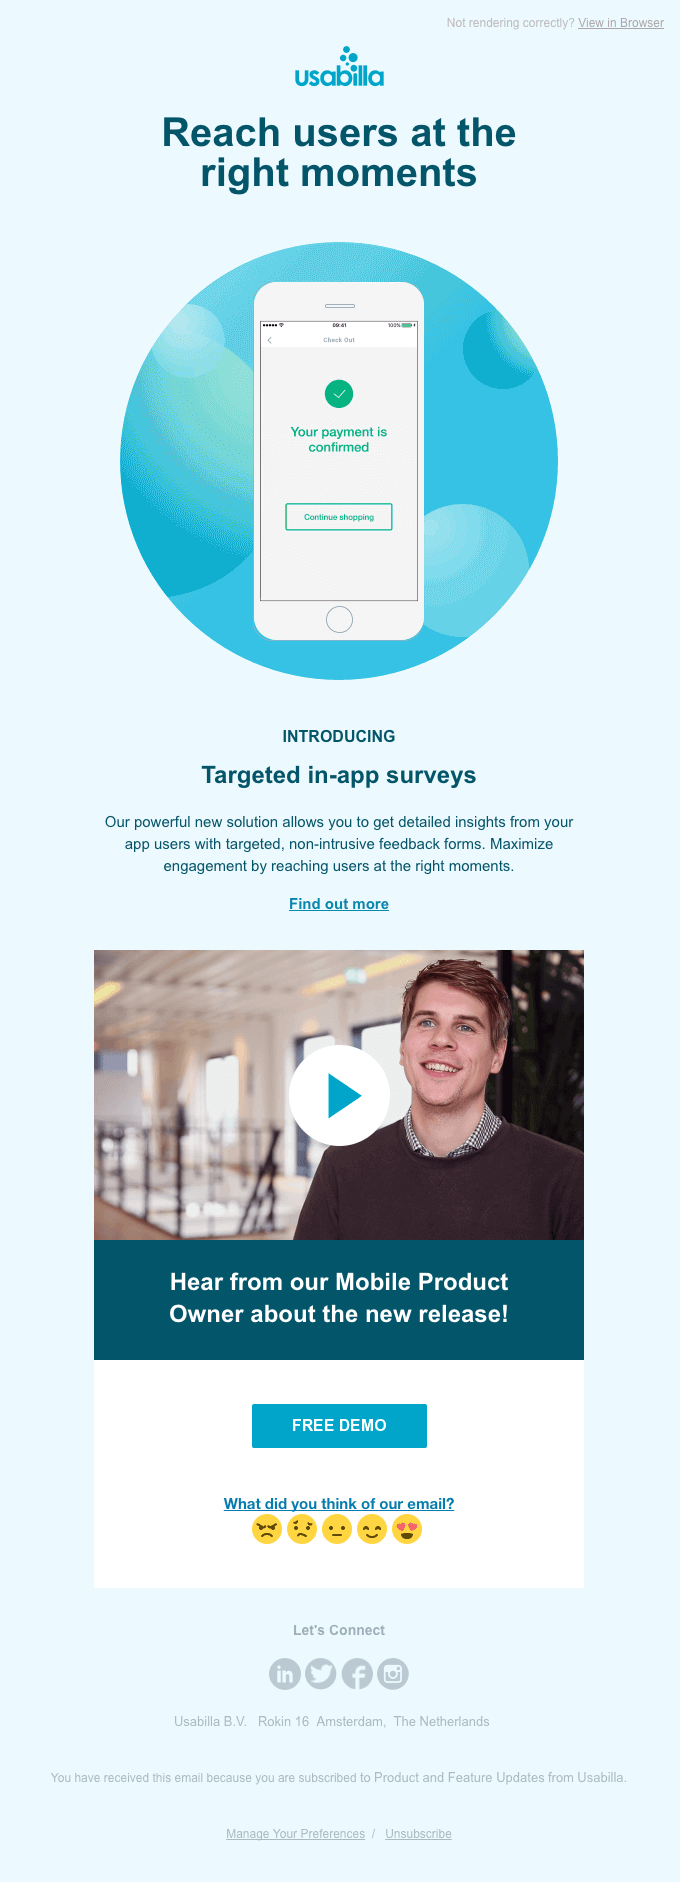
6. Usabilla promotes new in-app survey feature with user email
The customer feedback and survey platform Usabilla sent out an email to users to support the launch of its new targeted in-app survey feature.
The email includes a screenshot of the new feature, a brief description, a video from the Head of Product, and a CTA to read more about the new product feature in a more detailed blog post. The video is a great way to engage users beyond the typical email that only includes text and stills.
7. Buffer announces new feature page across its social media – and more
Buffer took to social media when announcing their new landing page feature, Start Page. Their social media posts on Facebook, Twitter, and Instagram explained the benefits and how to get started.
In addition, they announced it on their website and created a video highlighting current user challenges and how their Start Page can solve them. All of this, put together, is a great example of an omnichannel approach.

New Features Click With Whatfix
The path forward is clear: announce new features across multiple channels, guide users step by step with contextual in-app support, segment experiences by role and industry, and track adoption with precision. Product teams and internal application owners who take this structured approach turn new features into a competitive advantage.
With Whatfix, application owners and product teams have an all-in-one platform to:
- Drive awareness with no-code in-app Pop-Ups and announcements.
- Nudge users toward adoption with Product Tours, Walkthroughs, Smart Tips, and Task Lists.
- Contextualize experiences with dynamic cohorts and AI-powered Guidance Agents.
- Track both guidance effectiveness and feature usage with Product Analytics to uncover friction, measure success, and continuously improve.
Whatfix helps leading organizations maximize the impact of every release by turning feature launches into lasting adoption.
Learn more about Whatfix for feature adoption →


