


If you’re on a product team, you know that prioritization among ideas and tasks is one of your most important functions and arguably the most difficult. Prioritizing means making tough choices and wading through biases and other product management challenges.
You’re most likely familiar with disagreements about what to prioritize first. These can be internal to the product team or result from a lack of cross-functional alignment with other teams. For example, the product team might feel passionate about an initiative, but the tech team pushes back and says it’s complex and utilizes too many resources.
Therefore, product management frameworks are often used to guide decision-making based on different criteria, and the RICE Scoring Model is among the most popular. RICE is a framework that endeavors to make prioritization more concrete, giving your team a better chance to avoid all of the above. Let’s dive in.
In this article, we’ll explore product prioritization, the RICE Scoring Model, and how it can help your team make decisions.
What Is the RICE Scoring Model?
The RICE Scoring Model is a framework designed to help product professionals make decisions in the face of the many challenges inherent in prioritizing ideas and tasks. The foundation of the RICE Scoring Model is that four primary factors should be taken into account when making product decisions: Reach, Impact, Confidence, and Effort. The model gives specific guidance for determining a numerical value for each factor and methodology for using those values to make product decisions.
The History of the RICE Scoring Model of Prioritization
RICE was developed by the product team at Intercom who tried out some of the other popular product management frameworks and never felt that it matched their needs precisely. Therefore, they used some of what they’d learned from other methods to create a model that matched their organizational culture and needs. Their efforts resulted in the RICE Scoring Model, which is still used at Intercom today and has gained popularity in the global community of product management professionals.
Four Factors of the RICE Scoring Method
As mentioned, the team at Intercom defined four primary factors to consider when prioritizing ideas and tasks: Reach, Impact, Confidence, and Effort. In this section, we’ll examine each of these factors in-depth and provide some examples.
Reach
Reach is defined as the number of people a particular product initiative will affect within a specific period of time. Consequently, reach is measured by the number of people or desired events over a specific period. Depending on your initiative, it might be something like “purchases per month” or “customers per quarter.”
Whatever metric you choose to calculate your reach score, it’s important to use actual metrics for which you have data as much as possible. This takes the guesswork out of understanding the impact of each initiative that you need to prioritize by assigning a reliable number.
Here are some examples of how a reach calculation might look:
Example 1: 1000 users see the upgrade screen weekly, and 15% subscribe. The reach is 1000 x 15% x 12 weeks per quarter = 1800 user upgrades per quarter
Example 2: This iteration will benefit all users who complete the export flow each quarter. There are 5000 unique exporters per quarter, meaning the reach is 5000 users per quarter.
Tips for Calculating Reach:
- Remember that the accuracy of your reach score depends on the precision of the numbers you use to calculate the score. So, if you’re working on a new initiative, it’s true that some variables can’t be completely foreseen. For example, in our previous example, though you may have 5000 unique exporters at the time of calculation, it’s possible that this will decrease to 4500 and you won’t know in advance. However, the fact that you chose a real and generally stable metric on which to base your calculation gives you a good chance of having a decently accurate score.
- Ask your marketing team for help if your initiative addresses a new market segment: Particularly when it comes to more innovative projects, you might find that you don’t have a particular metric to use when calculating your reach score because you’re addressing a new target audience or a subset of your audience for which you don’t have specific data in order to make an educated guess. In these cases, asking your marketing team if they can use marketing research methodology to help you make some estimations about market size and impact is often helpful.
Impact
When it comes to most product iterations, a big part of what you’re trying to accomplish involves having a positive influence on each user’s experience. The RICE framework defines the effect on a user’s overall experience as impact.
To define your impact number, you’ll first need to define what that impact looks like. Here are a few examples:
- Increased conversion rate due to increased value
- Increased feature adoption
- Decreased drop-off
Then, you’ll choose a number on the following scale:
- 3 = massive impact
- 2 = high impact
- 1 = medium impact
- .5 = low impact
- .25 = minimal impact
Example 1: This new subscription screen will likely significantly impact the conversion rate because users will see it immediately after trying this long-sought-after feature, so we’ll score it a 3.
Example 2: This minor UX tweak in the flow will probably decrease drop-off slightly, but it doesn’t solve the entire problem, so we’ll score it a .5.
Tips for Calculating Impact:
- Be wary of bias, since this is a chosen number rather than an objective metric: When you’re championing an initiative, it’s easy to simply choose “massive impact” since you’re already so sure of yourself, but this is a good opportunity to check your preconceived notions at the door in favor of accuracy. One way to do this is to ask colleagues to approximate the impact and decide on a final number.
- Limit yourself to one impact outcome for a better chance at choosing an accurate reach score: Instead of trying to come up with a number that represents multiple things (conversion, delight, user adoption, etc.), pick the absolute most crucial impact outcome and focus on choosing the right number based on what you know so far.
Confidence
This is where you can acknowledge what you don’t know and factor that into your overall RICE score. Confidence is your perception of how sure you are about the reach and impact scores that you’ve assigned.
For example, if you’ve defined high reach and high impact scores mainly based on gut feelings due to unavailable data points, your confidence score will be lower. Whereas if you’ve defined high reach and impact scores based on previous experiences with relevant data points, your confidence score will be higher.
Confidence is defined as a percentage according to this scale:
- 100% = high confidence
- 80% = medium confidence
- 50% = low confidence
- Less than 50% = very low confidence
Example 1: You’ve given an initiative high impact and reach scores based on the fact that you know the market segment it applies to very well, and behavioral data from a similar initiative that brought high impact results. The feature has been requested by the user segment with some frequency, adding to your confidence. In this case, you might say that your confidence is high and the number would be 100%.
Example 2: This initiative targets a new market segment that the organization is just experimenting with. It’s entirely new functionality that previously, might have been considered out of your product’s wheelhouse. Since the segment and the functionality are entirely new, you might be optimistic but with low confidence— making your number 50%.
Effort
The final number to determine before you calculate your RICE score is effort, which measures the amount of people power your initiative will take to execute. This is a crucial component of the score because it forces teams to consider whether an initiative’s impact justifies its required resources.
In the RICE framework, your effort number is expressed in ‘person-months.’ In other words, how many weeks or months of work will it take from different departments? Let’s take a look at some examples of how this works:
Example 1: This product initiative will take about 1 week of planning by a product manager, 1 week of design, and 2 weeks of an engineer’s time. That adds up to 4 weeks or one month, so the effort score would be 1.
Example 2: This project will take about 2 weeks of planning by a product manager, 2 weeks of design, and at least 1 month of development time from one engineer. That adds up to 2 months, so the effort score would be 2.
Tips for Calculating Effort:
- Use whole numbers to keep it simple: Since you’re working with estimates anyway, there’s no need to complicate your effort score (and ultimately, then, your final RICE score) with decimals. Our advice is to round up so that you’re looking at a worst-case scenario and therefore factor in unplanned obstacles.
- Ask department leads for their time estimates: Though it can be tempting to give your best estimate, it’s better to ask the professional lead how much time they think something will take. Generally, they’ll give the most accurate response because they’ll be able to envision everything step-by-step based on their expertise. Ultimately, this leads you to a more accurate effort number.
How to Calculate RICE Score
Once you’ve calculated reach, impact, confidence, and effort – you’re ready for the final step, calculating your total RICE score. The equation for calculating your final RICE score for product prioritization is: Reach X Impact X Confidence (divided by) Effort = Total Score
To better understand, let’s consider an example with the following RICE scores:
- Reach: 1500
- Impact: 2
- Confidence: 50%
- Effort: 2
Your final RICE prioritization equation would look like this: 1500 x 2 x 50% / 2 = 750
Your RICE score for this initiative, then, would be 750.
When using the RICE scoring model, the idea is to calculate the RICE score for each initiative that needs to be prioritized. Your resulting score communicates the “total impact per time worked” – which, of course, is what you want to maximize. So generally speaking, the higher the RICE score, the higher up on the list of priorities.
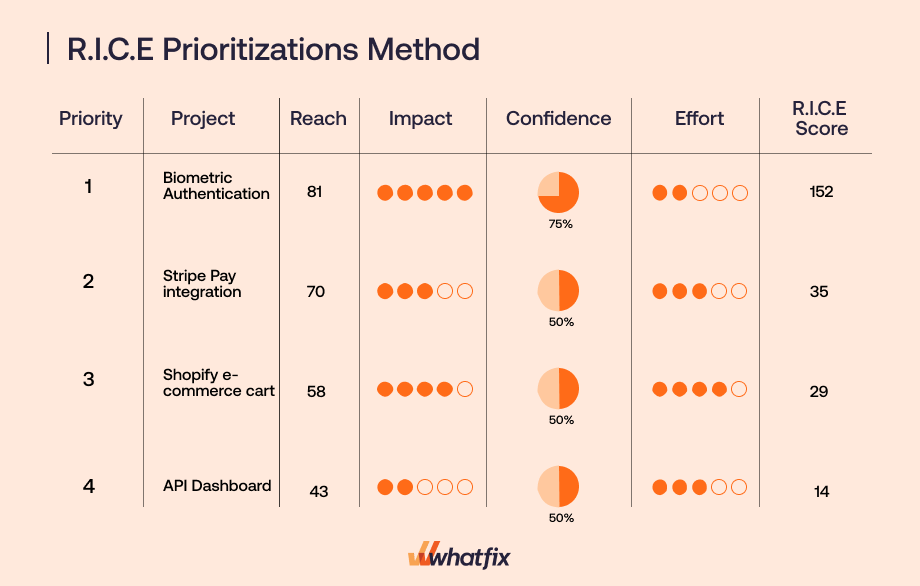
Example of the RICE Prioritization Method
The RICE prioritization method enables product teams to consider product updates, upgrades, and new features holistically and prioritize low lift, high confidence, and high impact. Below is a product roadmap example from an e-commerce app that scores various backlogged development projects based on the RICE prioritization model, providing clear guidance on which project should be prioritized first.
Tips for Using RICE for Product Prioritization
While there are no hard and fast rules, here are a few things to remember after you calculate your RICE scores and make prioritization decisions.
- Use the numbers to guide you, but be open to other input or information: Sometimes there are good reasons to prioritize your tasks differently than the RICE scores suggest. For example, your senior leadership tells you a specific initiative is vital to the investor leading the next funding round. Or, one specific initiative with a lower RICE score will set the stage and simplify implementation for a larger initiative. Use your RICE scores as a guide, but make sure that you’re factoring in everything important to you and your organization.
- Be transparent with your prioritization: If you’re using RICE, share the template with everyone on the product team and any other cross-functional stakeholders. When everyone knows what factored into these big decisions, they tend to be more motivated and do their best work.
- Update RICE scores as you learn: If you haven’t yet worked on an initiative but have more updated data or market information that might change some of the numbers you used to calculate your score – change your score! Keeping your RICE scores updated will help you be more accurate overall whenever you do a new round of prioritization.
Software Clicks Better With Whatfix
Using the RICE framework means utilizing data to determine the numbers to factor into the equation and maximizing a project’s impact once it’s been prioritized and launched. Let’s look at how Whatfix can help you do all of that, better.
Create product-led onboarding experiences and drive adoption of new features with Whatfix DAP
Armed with the highest RICE score on the list, you’re feeling pretty confident that your new feature is poised to have a big impact – but how can you be sure that your users have enough awareness and knowledge to use your new feature in an impactful way?
Using the Whatfix DAP, you can create an engaging version of your user onboarding that provides information about the new functionality without entering a line of code. Use these product-led onboarding experiences to drive as many users as possible to your new feature and maximize overall impact.
Provide on-demand user support with Whatfix Self Help
Your new product initiatives will likely have some level of complexity. Ensure that your impact isn’t stunted by complexity by giving users the information they need, exactly when they need it.
Using Whatfix Self Help, you can add new support articles to your knowledge base without the help of a developer, making sure that they’re ready to go alongside your feature launch. That way, users can find the answers they need and reap the benefits of the new functionality in a self-help resource center that overlays your applications.

Collect user feedback with Whatfix in-app Surveys
Surveys can help you determine your RICE numbers by asking your users questions that help you understand the extent of a problem that a specific product initiative solves. In-app surveys can also help you retrospectively understand how much value your iteration gave to your users so that you can learn to be more accurate as time goes on.
With the Whatfix, you can launch a survey and collect end-user feedback and insights from your users—once again, without needing to code.

Set up no-code event tracking and analyze user behavior with Whatfix Product Analytics
When calculating your RICE score, you’ll often want to use data from previous initiatives to help inform what numbers you assign to your future initiatives. Whatfix Product Analytics allows you to quickly and nuancedly examine your user behavior data to make informed decisions about prioritizing between product projects.

Ready to power your prioritization and adoption with Whatfix? Schedule a demo today!