


Efficiency is key to business success, but many organizations struggle with processes that waste resources and hinder growth. Streamlining business processes is a strategic necessity that can transform these challenges into opportunities for enhanced productivity and profitability.
This article explores the critical importance of optimizing workflows, offering practical strategies that can help your organization achieve operational excellence. By focusing on targeted improvements and leveraging innovative solutions, you can turn inefficiencies into competitive advantages, driving sustained success in a demanding marketplace.
What Is Streamlining Processes?
Streamlining processes means simplifying, consolidating, and automating workflows to eliminate bottlenecks, reduce friction, and amplify business results. In application management and digital transformation, it means rationalizing process flows for clarity, speed, and consistency across the enterprise. This elevates operational excellence, freeing up capacity, accelerating time to value, and igniting more meaningful work.
According to Gartner, a unified process automation architecture, built around principles like ADOPT (Abstraction, Discovery, Orchestration, Platform, Tasks), enables organizations to scale automation more effectively, reduce costs, and align workflows directly to strategic objectives. In finance, Gartner estimates robotic process automation (RPA) can save departments up to 25,000 working hours annually, translating into significant ROI (approximately $878,000 in cost savings for a 40‑person team. These efficiencies unlock budget reallocation toward innovation and value-added features for enterprise application owners.
For digital transformation ROI, streamlining processes is a foundational lever—simplified, efficient workflows underpin faster delivery cycles, higher adoption, and measurable financial benefits. Operations leaders see fewer errors, compliance teams gain audit-ready transparency, and product owners benefit from reduced deployment complexity and faster user feedback loops. In practice, this means fewer manual hand-offs, better vendor orchestration, seamless integration across platforms, and a culture that embraces continuous optimization—all hallmarks of application management maturity and operational excellence.
Functional Use Cases for Business Process Optimization
Process optimization reduces manual effort across departments, accelerates execution, and improves the quality of outcomes. By aligning workflows with enterprise goals, leaders can remove operational roadblocks, enable cross-functional collaboration, and ensure that critical business functions deliver consistent value at scale.
- HR: Streamlining benefits enrollment to ensure accurate employee data, faster processing, and fewer administrative errors.
- Sales: Automating lead qualification and follow-up workflows to improve conversion rates and shorten sales cycles.
- Customer Service: Optimizing triage and resolving tier 1 issues through automated ticket routing and self-service options.
- Finance: Simplifying expense report submission, approvals, and reimbursement to reduce delays and policy violations.
- Procurement: Standardizing new IT software vendor procurement workflows to ensure compliance, due diligence, and faster onboarding.
- Legal: Creating guided workflows for correctly executing contracts to prevent errors, missed steps, and compliance risks.
Industry-Specific Use Cases for Business Process Optimization
Every industry has unique operational pressures, from regulatory compliance in pharmaceuticals to customer trust in banking to administrative complexity in higher education. Optimizing industry-specific processes enables organizations to respond faster to market changes, meet compliance demands, and deliver better customer, partner, and end-user outcomes.
- Insurance: Digitizing and streamlining claims management to reduce processing time and improve customer satisfaction.
- Healthcare: Automating the submission of medical bills to insurance providers to minimize rejections and speed up payments.
- Pharmaceuticals: Standardizing the logging and tracking of quality events to meet regulatory requirements and ensure product safety.
- Higher Education: Simplifying student course enrollment reduces administrative burden and improves student experience.
- Public Sector: Streamlining small business form submissions for government loans and permits to improve transparency and turnaround times.
- Banking: Automating loan and mortgage approval processes to reduce manual review time and improve customer experience.
The Impact of Streamlining Business Processes
For enterprise leaders, streamlining business processes drives measurable efficiency, cost savings, and long-term scalability. Here are direct business outcomes of optimizing business workflows and tasks:
- Improved operational efficiency: Eliminates redundancies, bottlenecks, and unnecessary steps to accelerate task completion and project delivery. Standardized workflows clarify expectations, boosting productivity and reducing time-to-value for large initiatives.
- Reduced costs: Automation, digitization, and process improvements minimize manual work, wasted resources, and rework. Savings can be reinvested into technology, innovation, or market expansion.
- Increased agility & scalability: Flexible, optimized processes enable quick adaptation to market shifts, regulatory changes, and evolving customer needs, allowing for growth without proportional increases in overhead.
- Reduced user error & rework: Clear workflows, automation, and built-in quality controls reduce mistakes, prevent costly do-overs, and ensure outputs meet standards the first time.
- Better compliance & risk management: Structured, documented processes ensure adherence to regulations and internal governance, minimizing the risk of penalties and improving audit readiness.
- Enhanced data-driven decision-making: Process optimization tools provide analytics and predictive insights to identify bottlenecks, forecast risks, and guide faster, more informed decisions.
- Higher employee productivity: Removing friction from daily work allows employees to focus on high-value activities, fosters collaboration, and creates an environment for innovation and growth.
- Better customer experience: Efficient, consistent processes result in faster response times, higher service quality, and more personalized interactions, strengthening loyalty and driving revenue growth.
10 Best Practices to Streamline Business Processes
Streamlining business processes is beneficial and critical when ineffective processes affect customer satisfaction and an organization’s bottom line. Here are ten best practices to use when streamlining your organization’s business processes:
1. Map current processes
Start by mapping business processes currently in place across the area you aim to streamline. It will be helpful to visually diagram each step and include details about responsible employees and the resources they need to complete each task.
2. Tie processes to business outcomes
Once you’ve mapped each process, determine which departmental and organizational goals they contribute to. If goals have shifted since the process was implemented, and the process no longer aligns, earmark that process for improvement.
3. Identify areas of improvement with product analytics
Use data and product analytics tools from your software stack to analyze the effectiveness of your processes and use insights to identify silos, bottlenecks, digital friction, and resource waste. Determine which issues affect business outcomes most and prioritize them according to impact. This way, you can focus on eliminating the most egregious inefficiencies first.
4. Simplify and standardize
Return to your process maps and single out steps that can be automated, simplified, or cut altogether. If there are several processes with similar goals but differing steps, or if you notice one department handles a certain task more efficiently than another, take the time to standardize those processes so they follow a uniform progression of tasks. This will make it easier for employees to adopt new processes and understand how they function across the organization.
5. Leverage lean principles
Streamlining business processes through lean methodologies involves identifying and eliminating waste to enhance efficiency and value. By applying lean principles such as continuous improvement (Kaizen), value stream mapping, and just-in-time production, organizations can systematically analyze their workflows to pinpoint inefficiencies.
This approach reduces unnecessary steps, improves process flow, and optimizes resource use. Lean methodologies encourage employee involvement and feedback, fostering a culture of ongoing improvement.
By continuously refining processes and eliminating waste, businesses can achieve faster turnaround times, lower costs, and higher quality, ultimately leading to greater customer satisfaction and competitive advantage.
6. Enhance communication
Even optimized processes can fail without proper communication. Ensure that communication channels are open and utilized by your process streamlining team to prevent confusion about new process designs or rollouts. Develop plans to announce process updates and communicate further instructions with affected team members.
7. Provide support in the flow of work with DAP
Incorporate in-app messaging for processes performed with digital tools to guide employees through new, streamlined processes.
Implementing a digital adoption platform like Whafix empowers application owners and department leaders to easily craft personalized training content for users to navigate and utilize the digital tools from the outset. Whatfix offers features such as interactive walkthroughs, contextual pop-ups, and step-by-step tutorials that simplify complex workflows and reduce the learning curve. This immediate, in-app assistance minimizes errors and accelerates the adoption of new processes and systems.

8. Test the new workflow
Once your workflow has been documented, notify employees to implement the new changes in their daily work. Perform A/B testing to try out slightly different versions to ensure you optimize workflows and determine how your improved process fares in a live environment.
9. Refine and optimize where needed
As employees implement your streamlined processes, monitor key metrics and KPIs to continue revealing areas that could benefit from further streamlining. As you update processes, work with managers and other relevant teams to update training content and keep employees in the loop.
10. Focus on customer impact
Every business process must function to serve the larger purpose of providing customers with stellar service. Keep your process streamlining efforts focused by building processes with the customer in mind. Consider the impact on your business’ customers every step of the way.
8 Methodologies for Streamlining Business Processes
The importance of streamlining business processes is widely acknowledged across virtually every industry. Over the years, many formal methodologies have been developed to help businesses facilitate process streamlining. Here are some of the most common ones:
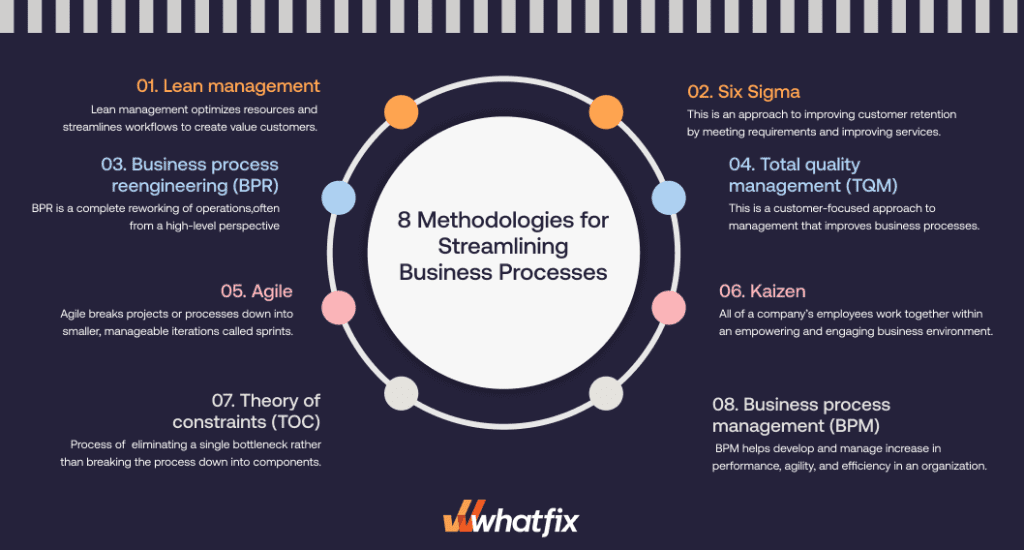
1. Lean management
Lean management is a business management approach based on the decades-old process management principles of the Toyota Production System: the Toyota Way. This framework centers on optimizing resources and streamlining workflows to create value for customers and eliminate overproduction, wasted time and resources, and defective products and services.
There are five core principles to the lean methodology:
-
Identify value: pinpoint the problem that needs to be solved and create a product or process to solve it
-
Map out value streams: map out workflows, including all employees and resources involved, to determine if any steps can be tweaked or eliminated
-
Create a continuous workflow: eliminate bottlenecks and interruptions to keep processes in motion
-
Develop a pull system: decrease the waste of processes to ensure optimal outputs
-
Facilitate continuous improvement: take regular measures to adjust and optimize processes
2. Six sigma
Six Sigma, or six standard deviations, was developed in the 1980s to standardize defect counting and address product quality issues. The name comes from the Greek letter sigma (σ), the symbol for one standard deviation in statistics. Six Sigma refers to an extremely high level of performance and accuracy, producing only 3.4 defects per million instances.
Six Sigma has five key principles that contribute to its goal of nearly perfect service:
- Prioritize value for the customer
- Identify the root cause of problems
- Eliminate waste and defects
- Promote collaboration among stakeholders
- Keep processes flexible and responsive
When applied more broadly to business processes, Six Sigma is an approach to process optimization and streamlining that centers on improving customer retention by meeting requirements and improving products and services.
3. Business process reengineering (RPG)
This strategy involves a full overhaul of core processes and business operations to improve outputs like quality, speed, costs, and profits. As opposed to other approaches to process improvement that focus on pinpointing and removing inefficiencies here and there, BPR is a complete reworking of operations, often from a high-level perspective. This approach tends to make the most sense for an organization facing large-scale issues with the overall management of its business processes.
4. Total quality management (TQM)
TQM is a continuous, customer-focused approach to management that uses data, strategy, and effective communication to improve business processes. One unique aspect of TQM is the premise that all of an organization’s employees are committed to reaching business goals and that this total employee involvement can only be achieved within empowered work environments.
There are eight principles central to Total Quality Management:
- Customer focus
- Total employee involvement
- Continuous improvement
- Process thinking
- Integrated systems
- Strategic and systematic approaches
- Data-based decision making
- Strong communication
5. Agile
Agile is a project management methodology that breaks projects or processes down into smaller, manageable iterations called sprints. At the end of each sprint and before the next, teams are encouraged to reflect on performance and adjust strategies if necessary. This regular feedback and adaptation creates continuous opportunities to improve and streamline processes.
Within this framework, teams create an empowering environment for effective processes by prioritizing team collaboration, customer collaboration, effective outcomes, and adaptability to change over more traditional and rigid business philosophies.
6. Kaizan
The concept of Kaizen is a combination of the Japanese words Kai (change or revision) and Zen (virtue or goodness), which come together to form a term meaning continuous improvement. Under this philosophy, all of a company’s employees work together within an empowering and engaging business environment.
Kaizen has five core principles that contribute to good housekeeping, the standardization of processes, elimination of waste:
- Know your customer (create customer value)
- Let it flow (target zero waste)
- Go to Gemba (following the action)
- Empower people (organize your teams)
- Be transparent (speak with real data)
7. Theory of constraints (TOC)
The Theory of Constraints is an approach to process streamlining that focuses on identifying the limiting factors, also called bottlenecks, impeding the desired outcome of a process and systematically removing the constraint until it no longer poses a problem.
This approach comes from Eliyahu M. Goldratt’s novel, The Goal: A Process of Ongoing Improvement. With the TOC, the focus is on eliminating a single bottleneck rather than breaking the process down into components and making improvements bit by bit.
8. Business process management (BPM)
Business process management (BPM) is a methodology that views business processes as assets to be developed and managed to increase performance, agility, and efficiency across an organization. This approach typically involves implementing a BPM software platform that uses data analytics to assess processes and provide insights for improvement.
Examples of Business Process Optimization With Whatfix
Modern organizations utilize enterprise software and technology as a foundation to build business workflows across departments and functions. Let’s look at a few examples of how companies are streamline their business processes by using Whatfix to identify process friction and support employees in the flow of work with guided experiences.
1. Optimizing expense management workflows
OMRON, a global leader in industrial automation and healthcare technologies, faced challenges in streamlining its expense management process, primarily due to frequent errors and inefficiencies in employee submissions on SAP Concur. These inaccuracies led to delays, increased administrative overhead, and a high rejection rate. Recognizing the need for a solution to enhance user understanding and compliance, OMRON implemented Whatfix’s digital adoption platform to improve the expense management workflow.
By leveraging Whatfix, OMRON created in-app guidance, step-by-step walkthroughs, and tailored self-help resources directly embedded within SAP Concur. These tools empowered employees to submit expense claims correctly and efficiently by providing contextual guidance during each step of the process. This proactive approach not only reduced the rate of errors but also ensured compliance with company policies, eliminating the need for extensive back-and-forth communication between employees and the finance team.
As a result, OMRON achieved a significant reduction in expense claim rejections, improving overall process efficiency and employee satisfaction. The adoption of Whatfix’s digital adoption solutions optimized the expense management workflow and underscored the importance of user-centric solutions in driving business process improvements. This success story highlights how digital adoption platforms can be critical in modernizing and streamlining operational processes.
You can read the entire OMRON + Whatfix case study here.
2. Accelerating performance management process
A multinational organization faced low performance review completion rates conducted through SAP SuccessFactors. Despite the platform’s robust features, employees struggled to navigate the system, leading to delays and incomplete reviews. This hindered timely evaluations and impacted the organization’s ability to maintain consistent employee performance data and drive informed decision-making.
The organization implemented Whatfix’s digital adoption platform to provide real-time, contextual support within SAP SuccessFactors. With tools like in-app walkthroughs, Smart Tips, and self-help widgets, employees received step-by-step guidance tailored to their specific tasks. This proactive approach eliminated confusion and streamlined the performance review process.
The results were striking: the organization significantly improved its performance review completion rates while also enhancing employee confidence and engagement with the system. By seamlessly integrating Whatfix’s digital adoption solutions, the organization optimized a critical HR process, demonstrating the transformative potential of user-focused technology in enhancing business outcomes.
3. Reducing loan processing time
A leading financial institution faced challenges streamlining its loan processing workflows on nCino, a digital banking software. Complex workflows and a lack of familiarity with the platform led to delays in employees’ creation of loan approvals, impacting customer satisfaction and operational efficiency.
The bank integrated Whatfix’s digital adoption platform within nCino to create in-app guidance to support its loan officers in the flow of work. By providing users with real-time in-app guidance, step-by-step walkthroughs, and contextual self-help tools, Whatfix simplified complex processes and enabled loan officers to complete their tasks more accurately and efficiently. The platform also empowered users to resolve their queries, significantly reducing the dependency on support teams.
The results were transformative: the institution achieved a measurable reduction in loan processing time, leading to faster customer service and enhanced operational efficiency. Whatfix’s digital adoption solution optimized critical banking workflows and underscored the value of empowering users with intuitive, just-in-time support to drive better business outcomes.
4. Reducing leakage in the claims process
An insurance provider struggled with claims leakage due to errors and inefficiencies in its claims processing workflows on the Duck Creek platform. Manual mistakes, process misunderstandings, and incomplete task execution contributed to financial losses and delays, ultimately impacting customer satisfaction and operational performance.
The insurance company implemented Whatfix’s digital adoption platform within Duck Creek. With features like real-time in-app guidance, interactive walkthroughs, and contextual Smart Tips, claims handlers were empowered to easily navigate the platform and complete tasks accurately. The solution also included self-help widgets for on-demand support, reducing the need for frequent intervention from IT or support teams.
This proactive approach significantly reduced claims leakage, as users were equipped to follow the correct processes and complete tasks without errors. By optimizing claims workflows, Whatfix helped the provider enhance operational efficiency, minimize financial losses, and improve overall customer satisfaction. This success story highlights how digital adoption platforms can play a pivotal role in mitigating process inefficiencies and driving business outcomes.
5. Optimizing requisition order cycles process
A global enterprise faced inefficiencies in its procurement process due to lengthy requisition order cycles on SAP Ariba. Complex procurement workflows and a lack of user proficiency often resulted in delays, errors, and increased costs, hindering the organization’s ability to maintain a streamlined supply chain and meet operational demands efficiently.
The organization integrated Whatfix’s digital adoption platform into SAP Ariba. Whatfix provided real-time in-app guidance, interactive walkthroughs, and task-specific Smart Tips that simplified the procurement process. These tools empowered users to complete requisition orders accurately and efficiently while reducing their reliance on support teams through on-demand self-help resources embedded directly within the platform.
Implementing Whatfix substantially reduced requisition order cycle times, improving procurement efficiency and operational performance. By streamlining workflows and enhancing user adoption, Whatfix enabled the organization to optimize its procurement processes, reduce costs, and achieve better alignment with business goals. This case highlights the transformative impact of digital adoption solutions in driving process efficiency and organizational success.
Processes Click Better With Whatfix
The Whatfix digital adoption platform helps businesses analyze, build, and implement streamlined business processes through powerful in-app guidance and user behavior analytics. Take these steps to improve your company’s processes with Whatfix:
- Create role-based in-app guidance: With intelligent segmentation and smart contextualization, Whatfix makes it possible to deploy personalized in-app guidance so employees receive relevant learning content to improve process adoption and boost productivity.
- Support employees in the flow of work with contextual help: Program in-app support messages to be triggered when users take certain actions within the software application. This ensures that users receive useful support in their moment of need without having to navigate away to seek out solutions or submit an IT ticket.
- Analyze in-app content usage and user behavior with analytics: With Whatfix Analytics, you can track critical metrics and KPIs to monitor how your user base interacts with the software and carries out existing business processes. Use this information to identify pain points in the user journey as well as redundant or unnecessary steps in your organizational processes.
- Use this data to create additional in-app content to improve process efficiency: Now, you have everything you need to reduce user friction with improved in-app guidance and maximize your processes’ efficiency. From here, continue to monitor employee usage and process outputs, and continue streamlining processes as your organization grows.
To learn more about Whatfix, click here to schedule a free demo with us today!