Change is an inevitable and constant aspect of any organization’s growth and evolution. To successfully navigate these transformative journeys, businesses need an effective change management strategy.
KPIs play a pivotal role in measuring the success and impact of change management initiatives. These metrics provide valuable insights into the effectiveness of change efforts, employee engagement and adoption, and the overall progress toward desired outcomes.
In this article, we’ll discuss common change management metrics to track and how to develop your change KPIs. These KPIs and metrics help overcome process inconsistencies, provide agility, keep your change projects on track, and achieve your intended outcomes.
12 Must-Track Change Management KPIs & Metrics
Here are nine of the most common (and useful) KPIs and metrics for organizations to track their change management success:
1. Change rejection rate
Change reject rates measure the number of proposed changes that are rejected or never implemented. They help track internal resistance, obstacles, or challenges faced during an organization’s change process—often caused by more deep-rooted issues such as company culture, structure, undertrained employees, or outdated technologies.
High change reject rates can indicate organizational or change-specific issues such as:
- Poor change design: Proposed changes may not be well-designed or may not adequately address the issues they’re meant to resolve.
- Inadequate change communication or no justification for change: Key stakeholders may not understand the need for the change or how it will benefit them and the organization.
- Lack of stakeholder engagement: Those who are affected by the change may not have been adequately involved in the change process, leading to a lack of ownership and acceptance, high resistance to change from those most impacted by it, and team members who are not properly skilled to implement the change.
- Insufficient training and support: There may not be enough resources (such as time, money, and personnel) to implement a change effectively. This also includes organizations failing to properly upskill employees or provide change management training to support the change.
Monitoring and analyzing your change rejection rate helps identify potential barriers to change, among others, to successfully drive change implementation. By addressing these issues, organizations can improve their change management processes, increase stakeholder acceptance, and more effectively achieve their strategic goals.
2. Employee satisfaction or engagement
Employee engagement metrics help assess employees’ perceptions of a change initiative and their level of involvement and commitment. By tracking employee satisfaction or engagement, organizations gain insights into how employees perceive and respond to change, which can influence their productivity and overall performance.
Change leaders can measure relevant employee satisfaction KPIs through NPS, pulse, and anonymous employee surveys.
3. Employee training effectiveness
When implementing a new change, organizations face reskilling challenges. To overcome this, companies must invest in general change management training programs for their entire workforce, as well as contextual training for employees impacted by specific change projects.
But how do change leaders measure training effectiveness?
Training metrics track the success and impact of change onboarding and reskilling initiatives related to the change, whether that’s a new software application, process, workflow, or team structure.
A few metrics to track post-change training effectiveness include:
- Total number of employees who have completed a training.
- The number of employee training programs organized by a company.
- The level of knowledge retention or skills acquired through the training.
These change metrics help to gauge workforce readiness and enable employees with the skillsets to take advantage of a new change initiative.
4. Adoption rate
User adoption rate measures the percentage of employees who have successfully adopted a new change, such as a new digital application, process, or workflow. It provides insights into the level of acceptance, utilization, and integration of new processes, systems, or initiatives within a team or organization.
Tracking user adoption helps determine the effectiveness of the change and how the workforce has embraced it. Low user adoption significantly hinders an organization’s ability to achieve ROI from its technology investments.
5. Time-to-adoption
While user adoption rate measures the overall adoption of a change project or initiative, time-to-adoption measures the time it takes to achieve an expected business outcome from a change transformation.
To measure this change KPI, monitor the time to adoption to know how long it takes for employees or users to fully adopt the change. This metric provides valuable insights into the speed and efficiency of the adoption process.
6. Change success rate
Change success rates measure the overall success of a change initiative in achieving its intended objectives or outcomes. It assesses the extent to which the change has been implemented effectively and has delivered the expected benefits.
Depending on the nature of the change, there are several ways to measure its success rate. You may tie it to the adoption rate, the organization’s KPIs, employee engagement, or other metrics that align with the change initiative’s objectives.
7. Stakeholder satisfaction
In this case, stakeholders may include leaders, managers, employees, customers, suppliers, or any other individuals or groups impacted by the change. Measuring stakeholder satisfaction is essential to gauge their level of support, engagement, and perception of the change initiative’s success.
To measure it, you need to develop a quantifiable metric that indicates stakeholder satisfaction. This can be done through rating scales, satisfaction scores, or direct feedback.
8. Change cost
You need to track change costs to assess the financial impact of change initiatives and ensure effective resource management. Change costs are a sum of all expenses associated with change implementation. They include employee training costs (direct and hidden), technology costs, process disruption costs, employee time and resources, and other expenses.
9. Business impact and ROI
The ultimate goal of measuring all the mentioned change KPIs is to assess the change initiative’s overall impact on the organization’s performance and financial outcomes. The final step is to measure the change initiative’s ROI.
Start by identifying the financial benefits or gains resulting from the change initiative. This includes increased revenue, cost savings, productivity improvements, reduced operational expenses, improved customer satisfaction, or any other measurable financial impact.
Assign monetary values to these benefits and subtract the total change cost from the total financial benefits. Divide the net financial benefit by the total investment costs and multiply the result by 100 to express the ROI as a percentage. To determine the extent of the impact, compare the post-change results against the baseline or pre-change measurements.
10. Open changes
Open changes indicate your organization’s change management capacity and efficiency. The number of active changes helps leadership understand workload distribution and resource allocation. By tracking this metric, you can identify resource constraints or process inefficiencies before they impact the business.
A sudden increase in open changes might signal the need for additional resources or process improvements. Conversely, a steady decline could mean improved efficiency or potential gaps in your strategy.
11. Changes waiting for authorization
This KPI measures the efficiency of your change approval process and highlights potential bottlenecks. By tracking changes awaiting approval, organizations can reduce the number of changes that get delayed by administrative processes.
Monitor the number of pending approvals, average wait times, and authorization success rates. Consider implementing automated notifications and escalation procedures for changes that exceed target authorization times.
12. Change lead time
Change lead time is the total duration from the initial request to successful implementation. You can find stages that need optimization by breaking down lead time into components (request to approval, planning, implementation, and closure).
How To Develop Change Management KPIs?
There’s no one-size-fits-all selection of KPIs that you can choose for your project. Follow these simple steps to define the right KPIs for your change management initiative.
1. Define change objectives
What are you aiming to achieve through the change? Clearly articulate the specific objectives of the initiative.
Whether you’re aiming for increased operational efficiency, enhanced customer experience, or improved employee engagement, you should develop a measurable objective aligned with the organization’s strategic goals.
For example, instead of stating “improve operational efficiency,” a specific objective could be “reduce the average process time by 20%.”
2. Identify key areas of impact
The next step is determining the specific areas within the organization that the change initiative will influence. Analyze the organization’s existing processes and workflows to identify areas where the change initiative is likely to have the greatest impact.
Identify areas where the change may introduce new risks or challenges and areas where it presents opportunities for improvement or competitive advantage.
Prioritize the identified areas of impact based on their significance and alignment with the change objectives. Focus on the areas that have the highest potential for positive impact.
3. Determine milestones
Break down your change journey into achievable milestones to make it easier to assess the progress and success of the change initiative. For instance, if you’ve previously decided to “reduce the average process time by 20%,” the milestones may sound like:
- Collect data on the current average process time as a baseline measurement.
- Implement the redesigned processes on a small scale or in a specific department as a pilot.
- Achieve a significant reduction in average process time, such as reaching a 10% reduction milestone.
- Scale up the implementation of the redesigned processes across the organization.
- Finally, reach the ultimate goal of reducing the average process time by 20%.
4. Set targets and benchmarks
You need to set benchmarks against which to compare your milestones and objectives. Benchmarks serve as reference points or standards against which you can measure your performance. They can be based on industry best practices, internal historical data, or external performance comparisons.
You should also establish a deadline for achieving each change objective. Align the timeframes with the overall change timeline and the milestones identified. This provides a sense of urgency and creates a clear target to work towards.
5. Establish data collection methods
How will you gather the data to measure your change management KPIs? You need a consistent strategy to collect data systematically throughout your change initiative.
Here’s how you build one:
- Consider the types of data you need to collect. Identify both quantitative and qualitative data that will provide meaningful insights.
- Identify the sources from which you will gather the required data. This can include internal systems, databases, performance reports, employee surveys, customer feedback, or financial records.
- Choose the appropriate techniques for collecting the data. Establish various methods such as surveys, interviews, focus groups, observations, event tracking, or automated data collection through software systems.
- Define the step-by-step procedures for collecting data. Specify who will be responsible for data collection, how data will be gathered, and any guidelines or instructions to ensure consistency.
- Determine the frequency and timing of data collection. Establish a data collection schedule to ensure regular and timely updates.
6. Develop reporting mechanisms
Before starting the monitoring process, you must decide how often you’ll generate reports for your change management KPIs. Reporting is a way to transform raw data into meaningful information that supports decision-making and highlights progress.
To determine the appropriate reporting frequency, consider the needs of different stakeholders and data availability. This can range from real-time updates on dashboards to periodic reports, such as monthly or quarterly updates.
The reporting mechanisms should provide clear visual reports that effectively present the data. Use charts, graphs, and visualizations to enhance comprehension and highlight trends or patterns. Organize the information logically, ensuring the most important data is displayed prominently.
Where possible, automate the reporting processes using data visualization tools. Automation will streamline the generation of reports, reducing manual effort, minimizing errors, and allowing for faster data analysis.
7. Continuously monitor and evaluate
Next comes continuous monitoring. Establish a system to collect and analyze relevant data on an ongoing basis by using automated data collection, real-time dashboards, regular surveys, and change feedback mechanisms to gather information.
By keeping your finger on the pulse, you’ll be able to identify any gaps or areas for improvement that require attention.
8. Use data to drive action
Once you’ve collected and evaluated the data from your change management KPIs, use it to take informed actions. As you analyze the data, prioritize the areas that demand immediate attention. Focus on those with the potential to make the most impact on your organization.
With insights in hand, it’s time to transform them into actionable plans. Evaluate the resources at your disposal, such as budget, people, and time. Allocate them strategically, considering the scope and scale of the adjustments required.
How to Create a Change Management Dashboard
Building an effective change management dashboard helps organizations visualize and track their change initiatives in real time. The right dashboard puts metrics at the fingertips for quick, data-driven decisions.
In this section, we’ll cover:
- How to choose a data visualization partner to create your change dashboard.
- What to include in your dashboard.
- What chart and visualization types to represent your change report data.
How to choose a technology partner
Your organization needs tools to track and visualize change management data. Help desk solutions integrate change-tracking features into your existing workflows. Business intelligence platforms connect multiple data sources to create dashboards with real-time updates.
To select the right technology partner, evaluate your organization’s needs and capabilities:
- Map your current change management process, identifying data sources and reporting requirements. Consider the volume of changes you handle monthly and who needs access to the dashboard.
- For organizations already using IT service management tools like JIRA, extending your current platform with change management features may be the simplest path. This reduces necessary training needs and supports data consistency.
- Invest in a BI tool like Google Data Studio, Looker, or Geckoboard if you need to combine data from multiple systems or create different visualizations. These platforms power dynamic dashboards, but they require more technical expertise to set up and maintain.
What to include in your dashboard
- Open changes: All change requests currently active in your system
- Changes waiting for authorization: Change requests pending approval from stakeholders
- Changes by type: Breakdown of changes by category
- Changes by risk: Order of changes based on their risk levels
- Change failure rate: Percentage of changes that failed or required rollback
- Change lead time: The time from change request to successful implementation
- Time in status: The time that changes spend in each workflow stage
How to choose reporting charts and visualization techniques
When selecting visualization methods, consider what will make your data the most clear and actionable. There are several options.
- Bar graphs highlight comparisons between different change types or statuses.
- Line charts reveal trends in metrics like lead time or failure rate over time.
- Heatmaps show patterns in change activity.
- Pie charts display the proportion of changes in different categories, and comparison charts track performance against benchmarks or goals.
Depending on your use case, you can explore other visualizations. Choose charts that tell a straightforward story and help stakeholders spot areas for improvement at a glance. For example, you might plot the number of successful, failed, and pending changes.
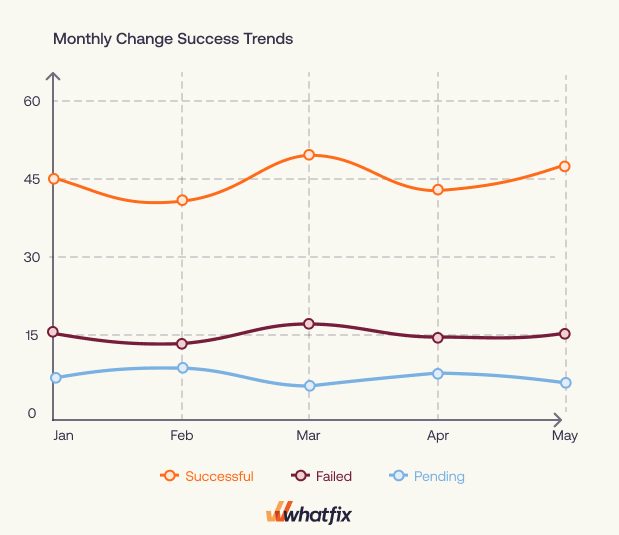
This visualization will reveal patterns. You can see if successful changes are increasing over time, if there are seasonal spikes in failures, or if you have too many pending changes.
Best Practices for Selecting and Implementing Change Management KPIs
Follow these tips to select KPIs that add value to your change management process.
1. Align KPIs with change objectives
Each KPI should reflect a specific aspect of your desired outcome and contribute to measuring the success of your change initiative. For example, if your objective is to improve customer satisfaction, relevant metrics may include customer feedback scores, net promoter score (NPS), or customer retention rates.
2. Keep KPIs specific and measurable
Avoid vague metrics. For instance, if you’ve chosen employee satisfaction as one of the KPIs, you should also specify how you’ll measure it and what benchmark you’ll be comparing it against.
3. Use a balanced scorecard
Instead of focusing on purely financial aspects of change management, a balanced scorecard allows you to recognize the value of all performance drivers, even non-financial ones. This framework provides a comprehensive view by incorporating multiple perspectives, such as financial, customer, internal processes, and employee growth.
4. Ensure KPIs are actionable
Select KPIs that are actionable and within your control. Focus on metrics that can guide decision-making and drive meaningful action. Avoid KPIs that are solely influenced by external factors beyond your organization’s reach.
5. Consider leading and lagging indicators
Leading and lagging indicators are types of measurements used to assess business performance. Leading indicators provide early warning signals and help predict future events, while lagging indicators focus on historical performance.
By considering both, you gain a more holistic understanding of your change initiative’s progress and performance.
6. Involve key stakeholders
When selecting KPIs, involve key stakeholders, including change sponsors, project managers, and impacted employees. Collaborate to identify the most meaningful metrics that reflect the success of the change efforts.
7. Regularly review and update KPIs
KPIs shouldn’t be set in stone. Continuously review and reassess their relevance and effectiveness. As your change initiatives evolve, ensure that your KPIs remain aligned and capture the most critical aspects of your progress and impact.
This ongoing measurement provides valuable insights into the progress and allows for timely adjustments if necessary.
8. Provide clear communication
Transparently communicate KPI progress to all stakeholders involved in the change initiative. Regular updates on KPI performance foster accountability and keep the change effort top-of-mind.
Change Clicks Better With Whatfix
A digital adoption platform (DAP) like Whatfix can significantly accelerate the adoption of enterprise change initiatives by providing employees with real-time guidance and support during the transition.
With its interactive walkthroughs, on-screen tutorials, and contextual tips, a DAP simplifies the learning process for new tools and processes, reducing the time it takes for employees to become proficient.
By offering step-by-step assistance and personalized learning experiences, a DAP boosts user confidence and minimizes resistance to change. DAPs track user interactions, enabling organizations to identify areas where employees may struggle and require additional help.
With Whatfix Mirror, you can quickly create interactive, replica versions of any web application to provide end-users with a sandbox environment for hands-on software training or user testing.
Ultimately, by leveraging a digital adoption platform, organizations can enhance employee performance, productivity, and satisfaction, facilitating successful and rapid adoption of critical enterprise change initiatives.
With Whatfix Product Analytics, you can set up custom event tracking, track software usage, benchmark time-to-completion, and other KPIs, analyze user behavior to identify areas of friction and dropoff, and use these insights to make data-driven decisions about testing new workflows or implementing task process changes.
Learn more about Whatfix, schedule a free demo with us today!