


Organizations invest significant resources in learning and development strategies and employee training programs. However, without a system to measure training effectiveness, L&D teams are left unsure whether their investments yield their expected results.
Effective measurement goes beyond tracking simply by tracking completion rates; it involves understanding if employees retain knowledge, how they apply new skills, and the impact it has on individual performance and overall business outcomes.
This article explores the importance of measuring training effectiveness, including key methodologies to measure training ROI, and highlights best practices for obtaining accurate and actionable insights. By adopting effective evaluation strategies, organizations can unleash the full potential of their training initiatives and strategically align them with their overarching goals.
What Is Training Effectiveness?
Training effectiveness refers to the degree to which a training program or initiative achieves its intended goals and produces desired outcomes. It assesses the impact and value of training efforts on individual learners, teams, and the organization. Measuring training effectiveness involves evaluating the transfer of learning from the training environment to the workplace and assessing the tangible and intangible benefits that result from the training program. Organizations can make informed decisions to enhance training strategies and allocate resources more effectively by understanding and measuring training effectiveness.
The Importance of Measuring Training Effectiveness
Here’s why it is essential to measure the effectiveness of your training programs.
- Maximizing ROI on training investments: Measuring training effectiveness ensures that your L&D resources spent on training—time, money, and effort—yield positive results. It helps organizations determine whether the training is contributing to improved performance and justify the investment.
- Aligning training with business goals: Training programs must support broader organizational objectives. By measuring effectiveness, organizations can ensure that the training aligns with business goals, such as improving productivity, boosting sales, or enhancing customer satisfaction.
- Identifying knowledge gaps: Assessment of training outcomes helps identify areas where employees may still lack essential skills or knowledge. This allows organizations to tailor future training initiatives to address these gaps more effectively.
- Enhancing learner engagement: Tracking training effectiveness can reveal learners’ engagement with the content. Engaged employees are more likely to retain and apply information in their roles. Insights gained can help refine training methods to boost engagement.
- Continuous improvement of training programs: Regularly measuring the impact of training allows organizations to refine and improve their programs continuously. By gathering post-training feedback and analyzing performance data, companies can adjust their training content, training methods, and tools to enhance the overall training experience and outcomes.
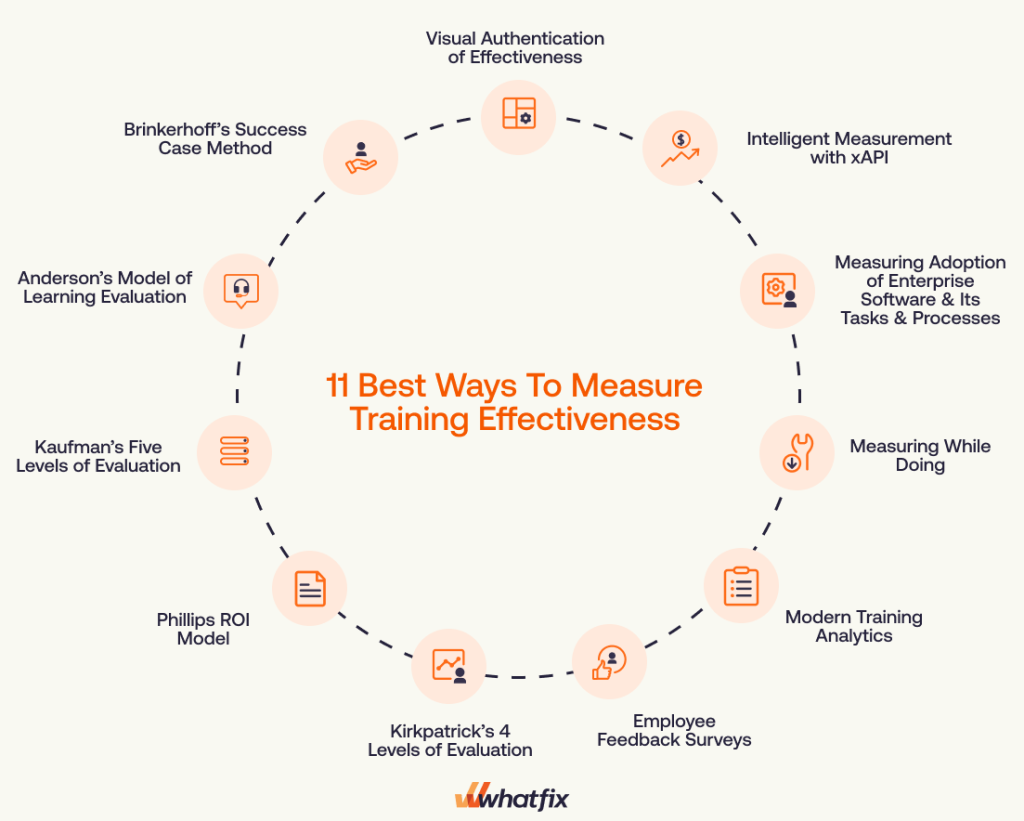
11 Best Ways To Measure Training Effectiveness
Outside of basic methods such as attendance tracking, completion rates, and skill assessments, it is time to consider new and engaging solutions that shed light on the effectiveness of your training programs. Here are eleven of the best ways to measure your organization’s training effectiveness:
1. Visual Authentication of Effectiveness
The visual authentication approach measures training effectiveness via visual confirmation of employees completing the learned tasks in real life. Employees upload videos, audios, or images as proof of a task completed by harnessing the learnings from the training sessions. Such visual proof helps managers gauge if the training is successful and tailor future sessions accordingly.
For example, L&D teams record salespersons’ pitches before training and compare them to the call with a prospective client after the training. The difference in the quality of the pitch helps L&D managers make improvements in future training modules.
2. Intelligent Measurement with xAPI
Nowadays, learning can happen anywhere and anytime, which is excellent for learners but poses tracking issues for the L&D team. The growing popularity of such blended learning, adaptive learning, long-term learning, and interactive learning experiences led to the advent of Experience API (xAPI).
xAPI (formerly known as Tin Can) content standards aid in producing personalized training content modules. Powered by analytics and reporting features, xAPI tells you exactly where learning is happening.
This communications protocol tracks learning-related activity from different sources and stores it in a learning record store (LRS). This means richer insights are mined that allow L&D teams to measure training effectiveness.
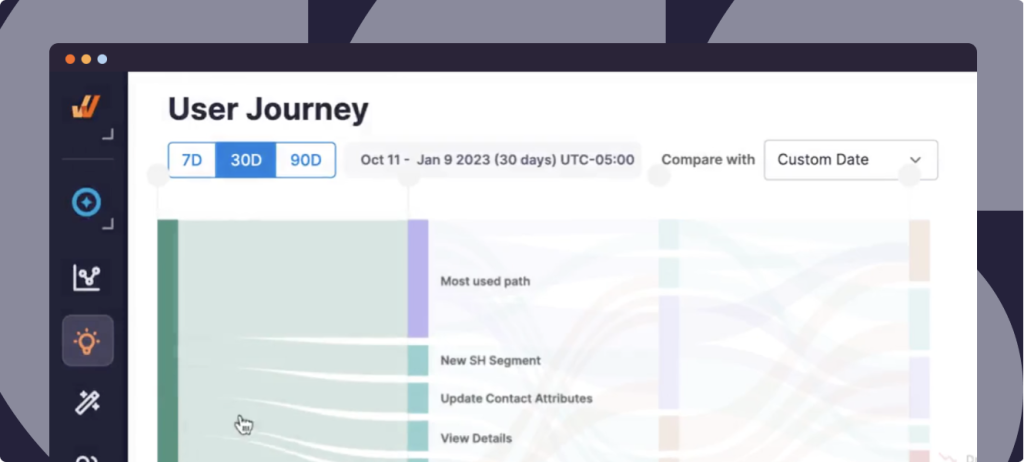
Digital adoption platform, such as Whatfix, harnesses xAPI to understand how users engage with the training content and leverage insights to improve the learning experience. It also presents metrics on content usage, user engagement, and the relevance of help content.
The vast and granular data gathered through xAPIs allow L&D teams to decide how training material can be edited in real-time, as the system understands individual learning preferences and knowledge levels. Consequently, the learner’s attention can be directed at relevant concepts, as the rest is automatically removed from the course.

3. Measuring Adoption of Enterprise Software & Digital Processes
For application training, measuring end-user adoption before and after the training is a beneficial outcome-based way to measure training effectiveness.
End-user adoption can be measured by conducting pre and post-training assessments, tracking user activity within the software to identify patterns of engagement and utilization, analyzing user feedback and surveys for valuable insights into learners’ experiences and challenges, monitoring performance metrics such as completion rates and task efficiency to assess the real-world application of training, and more.
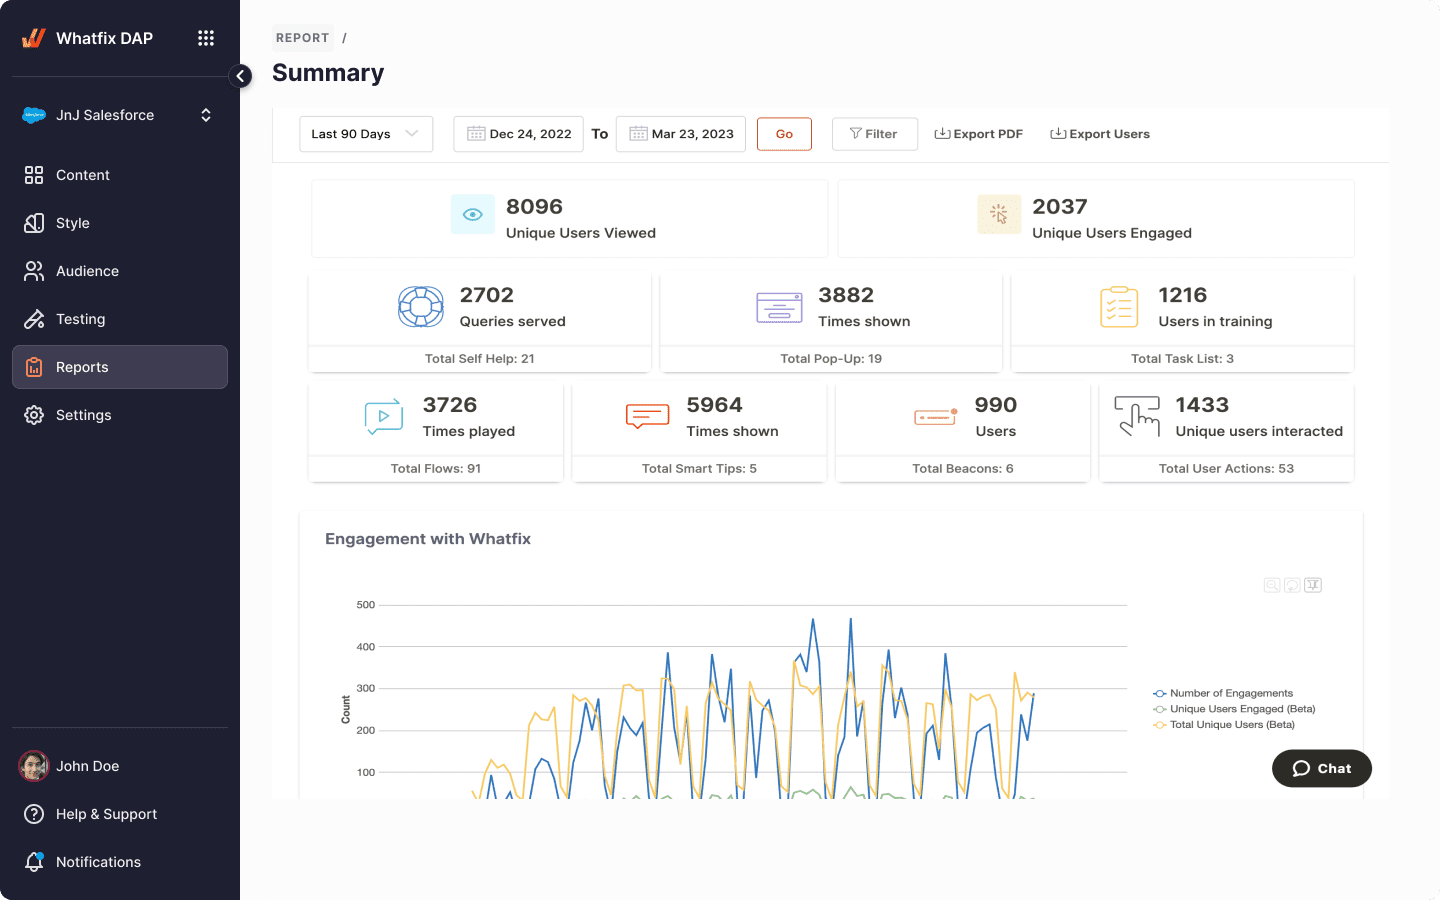
Some enterprise software provides adoption information within its dashboards, tracking how much time users spend on the system, how many activities are successfully completed, etc. These dashboards show how well users are engaging with the software and, hence, how well they can apply their learnings on the job.
WIPRO, a leading global IT, consulting & business process services company, leveraged Whatfix DAP to augment their sales training and understand how sales reps leverage software such as CRM, sales portal, and knowledge management system. The digital adoption platform tracked how many times employees accessed the in-app contextual walkthroughs in real time to identify the gaps in the training. It also gathered user feedback in real-time, right when employees accessed training and applied it to work. Such advanced analytics are critical in delivering an optimized learning experience and improving sales productivity.
4. Measuring While Doing
Measuring training effectiveness while doing refers to employing real-time assessment methods during the training process to gauge learners’ progress and grasp of the material. This can be achieved through interactive quizzes, polls, and knowledge checks integrated into the training modules, allowing learners to immediately apply what they have learned.
Utilizing training analytics to track learner engagement and progress during the training enables trainers to identify areas of improvement and adjust the training content dynamically. By measuring training effectiveness “while doing,” organizations can ensure learners stay actively engaged, reinforce their understanding, and address any knowledge gaps in real-time, ultimately leading to more effective and impactful training outcomes.
5. Modern Training Analytics
Modern training analytics uses data-driven insights to evaluate how well training programs achieve their objectives. By leveraging advanced tools such as Learning Management Systems (LMS), digital adoption platforms (DAP), and real-time tracking, modern training analytics provides a comprehensive view of how employees interact with training content and apply it in their roles. This method goes beyond traditional assessments, allowing organizations to measure learning outcomes, track engagement, and directly link training initiatives to business performance.
Key KPIs to track and analyze your training effectiveness include:
- Time-to-proficiency – Measures how quickly employees become proficient in their roles after training.
- Knowledge retention – Measures how much information employees retain over time after completing a training program.
- Training-to-task mastery transfer – Evaluate how well employees apply the skills or knowledge gained in training to their job tasks.
- Impact on core business or team performance metrics – Measures how training influences key business or team performance metrics, such as revenue growth, productivity, or customer satisfaction.
6. Employee Feedback Surveys
While they may seem like the most basic forms of evaluation, they are highly critical to determine the success of your training program. The approach here is to collect real-time feedback to measure training effectiveness and make required changes to the program immediately without delays. L&D professionals can curate a list of post-training survey questions to collect valuable feedback on company-wide and role-specific training.
Whatfix does this by intelligently gathering feedback on each walkthrough training flow to determine the gaps in your training content. The platform also integrates with survey tools to gather user feedback from specific locations (in-app) to ensure higher response rates.
You can also decode your learners’ relationship with the course with Net Promoter Score (NPS) rating [1 to 10]. This benchmark is commonly used for customer satisfaction analysis and can also measure training effectiveness. The NPS is derived from learners’ answers to the question: “How likely is it that you would recommend the attended training session to a friend or colleague?
7. Kirkpatrick’s 4 Levels of Evaluation
The Kirkpatrick Model of training evaluation is best known for analyzing and evaluating the effectiveness and results of employee training programs. It takes into account the style of training, both informal and formal, and rates them against four levels of criteria:
- Reaction – Understand learner satisfaction through feedback forms.
- Learning – Gauge the understanding of a topic and degree of skill development by taking pre and post-test measures and hands-on assignments. This helps understand if the training objectives were met.
- Behavior – Evaluate if employees apply their learnings from training to their everyday work.
- Results – Check if the business objectives (such as greater productivity and fewer errors) linked to corporate training are met.
8. Phillips ROI Model
The Phillips ROI Model is a methodology that ties the costs of training programs with the actual results. It builds on the Kirkpatrick Model and classifies data from different types employee training programs to measure:
- Reaction – Training managers use short surveys to gather data about participants’ responses to their training.
- Learning – Participants complete an MCQ survey or quiz both before and after the training for training managers to determine how much knowledge has been acquired.
- Application and implementation – The Phillips Model doesn’t only collect data to find if the training worked or not; it also evaluates the WHY behind the success/failure of the training. It adds qualitative feedback to the data process to help organizations improve their training programs.
- Impact – The model lets you analyze the impact of training content and other factors that contribute to participants’ final performance.
- Return on investment – Uses cost-benefit analysis to map impact data to tangible monetary benefits and a set of intangible benefits. Training managers can use this data as hard evidence to prove the value of training to the authorities.
9. Kaufman’s Five Levels of Evaluation
Kaufman’s model is yet another model built on the Kirkpatrick Model. It is a response or reaction to Kirkpatrick’s model that aims to improve upon it in various ways. Kaufman’s five levels of training evaluation include:
- Input – The training materials used to support the employee training.
- Process – Measure process acceptability and efficiency.
- Acquisition – Study whether learners acquired the learning and are using it on the job.
- Application – Evaluate how well participants utilize their learnings in their day-to-day tasks.
- Organizational payoffs – Measure payoffs for the organization as a whole. This level includes performance improvement evaluations and a cost-benefit or cost-consequence analysis.
- Societal outcomes – Measure the societal benefits of the contribution as a whole from and to the client and society’s evaluation.
10. Anderson’s Model of Learning Evaluation
The Anderson learning evaluation model is a three-stage evaluation cycle applied at an organizational level to measure training effectiveness. The model is more concerned with aligning the training goals with the organization’s strategic objectives.
The three cycles of Anderson’s model are:
- Determining current alignment against strategic priorities.
- Using a range of methods to assess and evaluate the contribution of learning.
- Establishing the most relevant approaches for the organization.
11. Brinkerhoff’s Success Case Method
Brinkerhoff’s success case method aims to identify and analyze the impact of training programs by focusing on extreme cases of success or failure. The approach answers two very important questions:
- “How well does a training program work in a best-case scenario?”
- “When a training program doesn’t work, what’s the reason for it?”
Here are the key steps involved in implementing Brinkerhoff’s success case method:
- Identify success cases: Identify individuals or groups who have demonstrated exceptional performance as a result of the training. These success cases represent the positive outcomes that can be directly attributed to the training program.
- Identify failure cases: Identify individuals or groups who have not achieved the desired performance improvements despite participating in the training. These failure cases represent the potential barriers or limitations of the training program.
- Conduct interviews: Conduct in-depth interviews with both success cases and failure cases. These interviews aim to gather detailed information about learners’ experiences with the training program, including what aspects of the training worked well and what challenges they faced in applying the learning.
- Analyze findings: Analyze the data collected from the interviews to identify common themes, patterns, and trends. This analysis helps determine the critical success factors as well as the factors that hindered the training effectiveness.
- Action planning: Develop action plans based on feedback and recommendations to enhance the training program. These plans may involve refining the content, delivery methods, and support systems or addressing specific challenges faced by participants.
Best Practices For Measuring Training Effectiveness
Measuring training effectiveness requires careful planning and implementation to ensure accurate and meaningful results. Here are some best practices to consider:
- Define objectives clearly – Establish measurable and realistic training objectives aligning with organizational needs and the specific skills or knowledge targeted. Having well-defined objectives allows for more focused measurement and evaluation.
- Invest in an analytics platform – An analytics platform like a Learning Management System (LMS) or a Digital Adoption Platform (DAP) automates data collection, tracks learner progress, and generates detailed reports. These platforms provide real-time insights into training effectiveness, helping organizations make data-driven decisions for improvement.
- Incorporate simulation tools – Simulation platforms like Whatfix Mirror allow employees to practice workflows in risk-free sandbox environments that replicate real applications. Beyond sandboxing, Mirror enables AI Roleplay for scenario-based conversations, Guided Experiences for step-by-step practice, and Adaptive Assessments to validate readiness through role-specific evaluations. These features give L&D leaders measurable insights into proficiency, knowledge retention, and skill gaps before employees transition into live systems, ensuring training translates into real-world performance.
- Use multiple evaluation methods – Relying on one method may provide a partial picture of training effectiveness. Using a mix of assessments (such as quizzes, surveys, observations, and performance reviews) allows organizations to evaluate knowledge acquisition and practical application, ensuring a comprehensive analysis.
- Collect data at various time points – Gather data at different time points to capture the training’s short-term and long-term impacts. Immediate post-training evaluations can assess learning retention and immediate skill application, while follow-up evaluations conducted weeks or months later can measure the transfer of learning to the workplace.
- Analyze qualitative and quantitative data – Analyze both qualitative and quantitative data to comprehensively understand training effectiveness. Quantitative data, such as assessment scores or performance metrics, provide numerical insights, while qualitative data, such as participant feedback or case studies, offer rich contextual information.
- Communicate findings and recommendations – Communicate the evaluation findings and recommendations to key stakeholders. Provide clear and concise reports highlighting the training’s impact, the program’s strengths, areas for improvement, and actionable recommendations. Effective communication helps gain support, secure resources, and drive organizational change.
Challenges in Measuring Training Effectiveness
Here are some challenges you might incur while measuring training effectiveness.
- Limitations of traditional metrics – Traditional methods, such as attendance rates and post-training quizzes, often only measure surface-level engagement. These metrics fail to capture deeper learning outcomes, such as behavioral changes or the practical application of skills, making it hard to assess the true impact of training.
- Difficulty in linking training to tangible business outcomes – It can be challenging to directly connect training initiatives to business outcomes such as revenue growth, productivity improvements, or customer satisfaction. External factors often influence these metrics, making it difficult to isolate the specific impact of training.
- Lack of real-time feedback – Many training programs don’t provide immediate insights into learner progress or understanding during the learning process. The absence of real-time feedback means trainers may not know whether learners are struggling until after the training is completed, delaying necessary adjustments.
- Gaps in long-term evaluation of knowledge retention – Measuring training effectiveness immediately after completion doesn’t capture how well employees retain and apply their knowledge over time. Without ongoing assessments, it’s difficult to evaluate whether employees continue to use their skills effectively or if reinforcement is needed.
Whatfix offers a complete solution for creating engaging, measurable, and effective training experiences. Its advanced analytics capabilities provide real-time insights into adoption, task completion, and engagement, enabling organizations to identify knowledge gaps and refine programs for maximum impact.
With Whatfix Mirror, employees can safely practice workflows in sandbox environments, rehearse scenarios with AI Roleplay, follow Guided Experiences for step-by-step training, and validate proficiency through Adaptive Assessments. Together, these tools ensure employees don’t just complete training but are confident, ready, and effective in live systems.
To see how Whatfix can help you measure, improve, and scale training effectiveness., schedule a free demo with us today!