Sales analytics isn’t an option; it’s a must for every organization, big or small. It unlocks insights into your sales performance, customer behavior, and overall business health. With the right tools and strategies, sales analytics can help you make data-driven decisions and drive business growth.
Let’s say your company provides a project management tool for remote teams. You’ve been experiencing a steady growth of user sign-ups, but you’re not seeing a corresponding increase in revenue. You suspect there might be a problem with your sales funnel.
By turning to sales analytics, you can identify the bottleneck in your sales funnel — a low conversion rate from free trials to paid subscriptions. The data shows you that many users aren’t fully exploring the product during their trial period, which means they’re not getting the full value of your software. You can resolve the issue by implementing an onboarding process that guides users through the most important features of your product during their trial period.
This is just one use case of sales analytics.
In this guide, we’ll explore the world of sales analytics, from tracking key metrics to choosing the right tools to drive sales performance. Whether you’re a sales manager looking to optimize your team’s performance or a business owner seeking insights into your company’s sales, this guide will provide the knowledge and tools you need to succeed.
What Is Sales Analytics?
Sales analytics is the practice of using data analysis techniques and tools to gain insights into sales trends, patterns, and customer behavior. The data helps to optimize sales strategies, improve sales performance, and increase revenue. This comprehensive process involves collecting, processing, and interpreting data related to sales, such as customer information, sales process, transaction history, etc. Sales analytics gives businesses actionable insights into various aspects of the sales process, helping to improve sales forecasting, pipeline management, customer segmentation, and the overall sales strategy.
Importance of Sales Analytics
Sales analytics has a tremendous impact on:
- Sales performance: By analyzing your past transactions and customer behaviors, you can improve your sales strategy to drive more conversions.
- Revenue: More conversions = increased revenue.
- Customer experience: Sales analytics allows you to understand your customers better and create sales processes tailored to their behaviors and needs.
- Planning: With historical data, you can create more accurate sales forecasts and predict future trends. You’ll make better decisions about inventory management, resource allocation, and overall business planning.
How to Track Sales Analytics
Sales analytics is a multi-step process. You can roughly split it into the following four stages.
1. Choosing the right tools
The first step in tracking sales analytics is to choose the right tools. Depending on your needs and budget, you can choose from a variety of platforms available. These are just a few examples:
- Salesforce: A sales automation and tracking tool for mid-sized companies and enterprises.
- HubSpot: A marketing and sales analytics platform for small and mid-sized businesses.
- Gong: A revenue intelligence platform best for the mid-market segment.
- Google Analytics: A free website tracking and analytics solution.
Make sure your sales analytics tool is compatible with your existing systems, and you’re good to go.
2. Collecting data
When you have a sales analytics platform in your toolkit, the next step is to collect and store data.
You need to choose the sources that will be feeding data to your analytics solution. It can be your website, email campaigns, paid advertising campaigns, and/or any other point of interaction with your prospects and customers.
Set up tracking codes or integrate your tools to constantly collect real-time data if needed. For instance, if you choose to analyze your website activity with Google Analytics, you should paste the Google Analytics tracking ID after the <head> tag on each page of your site. From now on, you’ll see all website interactions in your Analytics account.
3. Data analysis and interpretation
As you get more and more data, it’s time to analyze and interpret it.
A lot of sales analytics tools do the most difficult job for you. But you need to configure them first to give you the insights you need. For instance, tools like Salesforce and Outreach can turn your historical sales data into accurate forecasts — you just need to specify what kind of data you want to see there and what factors the tool should consider when creating a forecast.
These tools can also generate custom reports or dashboards to visualize data in a way that is easy to understand. And here we’re nearing the last step of the process.
4. Sales reports
Finally, a sales report is the ultimate result of the sales analytics process. It provides a comprehensive overview of sales performance, including metrics like revenue, conversion rates, and customer acquisition costs.
You can customize your sales reports to fit the needs of a business, but there are a few key elements that all sales reports should include:
- Key Performance Indicators (KPIs): KPIs can vary based on the goals of the business, but might include metrics like sales volume, sales velocity, customer retention rate, and customer acquisition cost.
- Actual performance vs. goals: Sales reports should provide a clear comparison of actual performance to goals.
- Trends: Sales reports should also include trend analysis to show changes in sales performance over time.
11 Key Sales Analytics Metrics to Track
These are the key metrics you should always include in your sales reports:
1. Revenue
This is the total amount of revenue generated by a business over a specific period. Revenue is a key metric for measuring your overall sales performance.
2. Average deal size
This metric refers to the average value of a sale. It’s calculated by dividing the total revenue generated from sales by the total number of deals closed over a specific period. For example, if a business generates $100,000 in revenue from closing 50 deals, the average deal size would be $2,000.
It’s a good idea to track how the average deal size changes over time to see the dynamics of your sales performance. For example, if the average deal size is decreasing, it may indicate that your salespeople are having a hard time converting high-ticket clients.
Tracking the average deal size helps businesses identify opportunities to pursue high-ticket clients and boost revenue.
3. Conversion rate
A conversion rate is the percentage of leads or prospects that complete a desired action, such as making a purchase or signing up for a service. Tracking conversion rates helps you understand how many leads are successfully converting into paying customers and where your sales process may be falling short.
Interestingly, a low conversion rate may not only point out the ineffectiveness of your sales activities but also indicate you’ve been generating the wrong type of leads.
4. Sales cycle length
Sales cycle length refers to the length of time it takes for a lead to move through the sales process and become a paying customer. The sales cycle typically begins when a lead first becomes aware of a business and ends when the lead makes a purchase or signs a contract.
By keeping track of this metric, you can create more accurate sales forecasts and set realistic goals for your team.
5. Customer lifetime value
Customer lifetime value (CLV) is a key sales analytics metric that estimates the total value of a customer throughout your relationship.
Tracking CLV is essential to sales analytics as it can help businesses understand whether your customer acquisition efforts pay off. If your customer lifetime value is too low, it may indicate that you’re attracting the wrong type of customers and need to revisit your marketing and sales strategies.
It’s also a great way to identify which customer segments are most valuable to your business. You can use this data to focus on building stronger relationships with those audiences.
6. Sales growth
Are your sales increasing over time? You need to track sales growth to measure the impact of the changes you’re making to your sales strategy.
To calculate sales growth, you need to know your revenue for a specific period in the present and your revenue for a similar period in the past. Then you should simply subtract your past revenue from your previous revenue and divide the result by your past revenue. Multiply the resulting number by 100% to get a sales growth rate.
7. Retention rate
Retention rate measures the percentage of customers who continue using your product (in the SaasS industry) or make repeat purchases (in eCommerce) from a company within a specific period of time.
It’s calculated by dividing the number of users that continue their subscriptions at the end of a given period by the total customers you had at the beginning of the same period and multiplying the number by 100%. For a deeper dive into retention, conduct a retention analysis to understand why customers stay or churn.
8. Sales by product
This metric is specific to businesses that offer different product lines. Calculating sales by product allows you to understand the performance of individual products and make data-driven decisions to optimize your product mix and drive revenue growth.
9. Sales by channel
Tracking sales by channel refers to the analysis of sales data based on the channels through which a company sells its products or services.
You may be promoting your products or driving sales through your company’s own website, social media channels, paid advertising campaigns, or online marketplaces like Amazon or eBay. And before you plan your marketing and sales efforts for the next quarter, you need to know which channels work best for you. The data will help you allocate resources accordingly.
10. Customer acquisition cost
Customer acquisition cost (CAC) is a metric that measures the cost of acquiring a new customer. CAC is calculated by dividing the total cost of sales and marketing efforts over a specific time period by the number of new customers acquired during that period.
Using a CAC calculator can help you identify areas where you can optimize your sales and marketing spending to reduce the cost of customer acquisition.
11. Salesperson performance
You need to measure salesperson performance to evaluate the effectiveness of your sales team and identify top performers and underperformers.
We’ve already listed some metrics that can be used to measure salesperson performance, such as the average deal size, conversion rates, and sales growth. You just need to calculate those metrics for a specific sales agent to analyze individual salesperson performance.
How to Use Sales Analytics to Improve Sales Performance
Here are the seven ways sales analytics can be useful to you:
1. Identify trends and patterns
Use sales analytics to identify patterns and trends in customer behavior, sales performance, and market trends.
2. Set sales goals and targets
Historical data will help you set more realistic sales goals for your team. By looking at metrics such as conversion rates, average deal size, and sales cycle length — as well as their dynamics — you can create more accurate sales forecasts and set challenging but achievable targets.
3. Monitor key metrics
Continuously monitor and analyze key sales metrics, such as conversion rates, customer acquisition costs, and customer lifetime value. Watch how results change over time to measure the impact of any changes.
4. Improve sales strategies
Use sales analytics to improve your sales strategy. When you spot issues with your sales performance, you can dig deeper into your sales data to identify the roots of the problem and fix it.
5. Optimize sales processes
By analyzing data on key performance metrics, such as lead-to-opportunity conversion rates, sales cycle length, and win rates, you can gain insights into how the sales process is working and where there is room for improvement.
6. Provide targeted sales training
Sales analytics can help you identify areas where your team may need additional sales training or support.
7. Adjust marketing strategy
Sales analytics also gives you insight into the effectiveness of your marketing campaigns. You can create a better sales and marketing alignment by sharing the sales data with your marketing team and creating a shared strategy.
How to Choose a Sales Analytics Tool
When choosing a sales analytics tool, there are a few critical factors to consider:
1. Data requirements
Consider the types of data you want to focus on. Some sales analytics tools may specialize in specific data types, such as web traffic, customer behavior, or sales team performance.
2. Integration
Your sales analytics tool should integrate with other business tools you use, such as your CRM or marketing automation platform. It’s great if your tool offers easy integration with your business system without the need to turn to API documentation and coding.
3. User-friendliness
Look for a sales analytics tool that is easy to use and doesn’t require extensive technical expertise. Even though you may be tech-savvy, it doesn’t mean your sales agents are.
The tool should be intuitive enough for your entire team to use as a go-to solution whenever they need to make strategic decisions.
4. Reporting and visualization
A sales analytics tool should provide clear and comprehensive reporting and visualization options. Ideally, a platform will offer to generate custom reports for you, complete with visualizations that make it easy to spot trends and patterns.
5. Cost
There are a lot of hidden costs behind implementing a sales analytics tool. When choosing one, you should remember that pricing will vary depending on various factors, like the number of people you have on your team, the number of monthly reports, etc.
For instance, revenue intelligence platforms like Salesforce and HubSpot get expensive quickly as you add more users. These solutions also have setup fees that you should consider before subscribing.
6. Customer support
You may face a lot of technical issues when implementing a sales analytics tool. Therefore, it’s critical that the company has a responsive customer support team that will assist you throughout your journey.
7. Scalability
Consider the scalability of your sales analytics tool and whether it can accommodate your business growth over time. Choose a tool that can handle increased data volume and complexity as your company grows.
Top 5 Sales Analytics Tools in 2024
Here are some of the best tools driving actionable insights for you to improve your sales strategy and increase customer retention:
1. Whatfix
If you sell a SaaS platform, Whatfix is a must-have tool in your tech stack. Whatfix analyzes user behaviors within your app to see how your new customers interact with the tool.
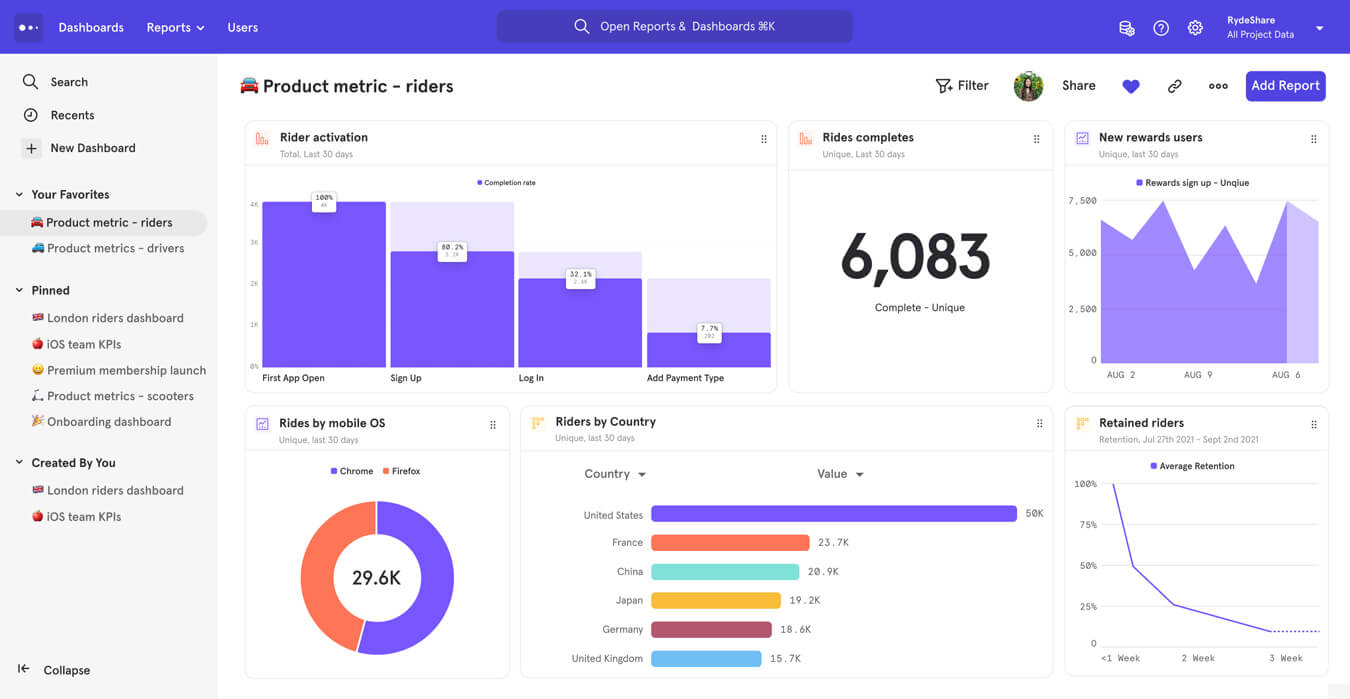
Whatfix Analytics displays clicks, page visits, mouse hovers, and other actions that indicate user engagement and pinpoint inefficiencies in the user journey.
In addition, you can connect Whatfix to your software to set up user onboarding flows, product tours, and tooltips to guide new users through your product interface (and yes, you can track the usage of your help content, too). For instance, by offering guidance to free trial users, you can increase sign-up rates while collecting valuable user experience data.
2. Zoho Analytics
Zoho Analytics is a cloud-based data analytics platform that helps sales teams analyze their performance and discover hidden insights. With Zoho Analytics, businesses can create reports and dashboards, perform data analysis, and share insights with team members.
The tool offers a wide range of features, including data visualization, data blending, and automated reporting. Zoho Analytics also integrates with various third-party applications, making it easy to connect with other tools that businesses may use.
3. Mixpanel
Mixpanel is a product analytics tool that helps businesses analyze user behavior on their websites or applications.
The tool provides insights into how users interact with the product, which can be used to improve the user experience and increase customer retention. Mixpanel offers features like user segmentation, funnel analysis, and event tracking, and integrates with various third-party applications to provide a comprehensive view of user behavior.
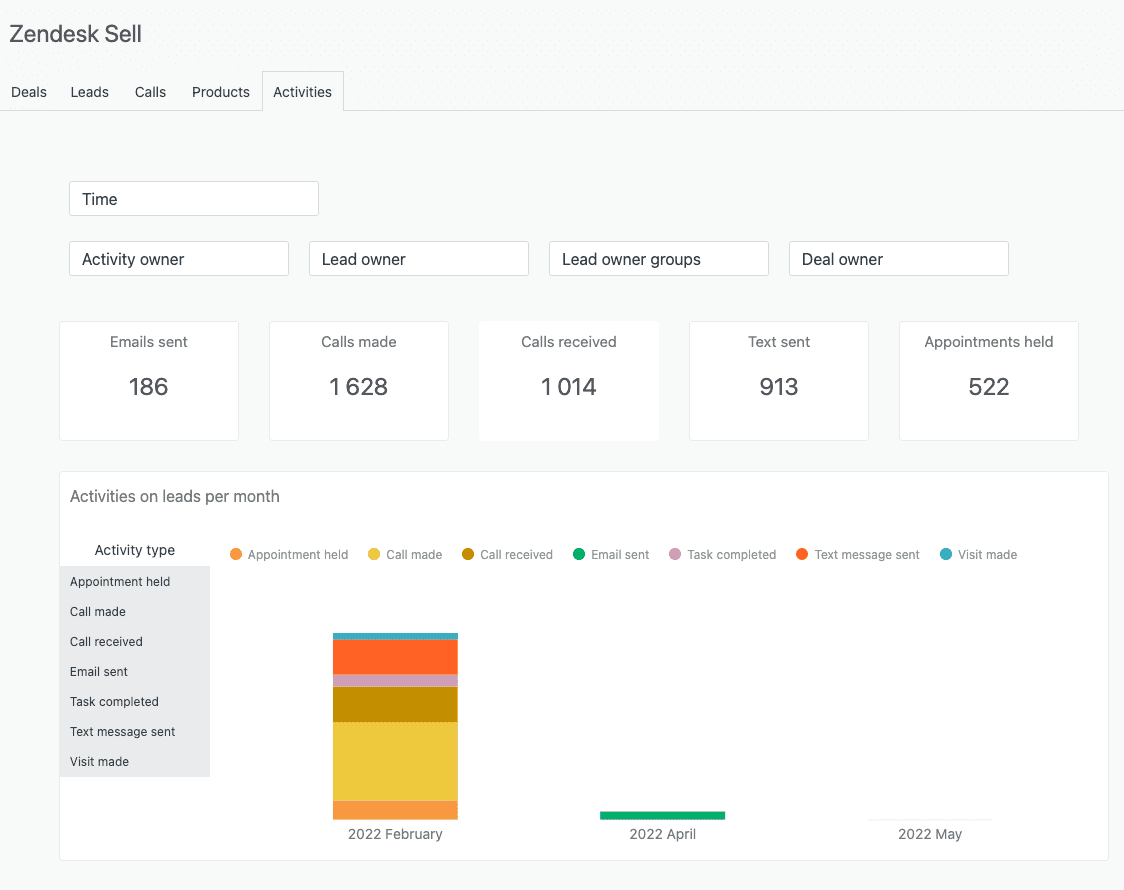
4. Zendesk Sell
Zendesk Sell is a CRM tool designed to help businesses manage their sales pipeline and customer interactions. The tool provides insights into customer behavior and sales performance, allowing businesses to make data-driven decisions to improve sales.
Zendesk Sell offers features like pipeline management, contact management, and sales reporting. It integrates with other Zendesk tools like Zendesk Support and Zendesk Chat to provide a comprehensive customer support solution.
5. Heyflow
Heyflow is a sales analytics tool that provides sales teams with real-time insights into their pipeline. The tool allows businesses to track their leads and deals, manage their pipeline, and analyze their sales performance.
Heyflow offers features like lead scoring, pipeline tracking, and sales reporting, and integrates with various third-party applications to provide a comprehensive view of sales data.

Sales Analytics Clicks Better With Whatfix
Set up no-code event tracking with Whatfix and capture, benchmark, and improve core product metrics. Track the impact of your sales efforts on your product engagement and vice versa. Take action on your user behavior data to improve customer retention with the help of in-app guidance and support content.
Book a demo to learn more about Whatfix Analytics!


")
")
")
")
")
")