

Customer retention and churn are two most effective metrics for projecting a product’s growth—they signal that you’re either solving your customers’ pain points and that they’re sticking around as a result, or that there’s something wrong with your funnel and that you’re on a death spiral.
That’s where retention analysis comes in: it helps you crack into where and why churn is occurring, analyze your retention metrics, compare them against historical trends, understand why and how they’ve developed, and chart a course toward positive growth or maintaining a retention streak.
Retention analysis is the process of examining user data to understand customer churn and retention. Conducting a retention analysis will help determine why customers churn or stay and identify potential signals for both.
If you (a product manager) suddenly notice a 60% spike in new signups still using your product after a 90-day window, you’ll probably want to investigate. And your goal would be simple: figure out which variable improved our retention rate (i.e., reduced churn) so significantly so that we can double down and optimize it further going forward.
That’s the question retention analysis answers: it’s the process of studying user metrics and product experience variables to understand how they impact your churn rates. Retention analysis answers questions like:
Retention analysis helps growth teams understand how and why customers churn (or stick around) so they can optimize their product experience/marketing/customer acquisition accordingly.
If you treat them as standalone, self-contained figures, metrics like churn, user retention, product stickiness, Customer Lifetime Value, Net Revenue Retention, and Customer Acquisition Cost (etc.) don’t make any sense.
40% of the customers we acquired in Q3 churned within 30 days.
Yeah.
And so? These metrics are helpful for measuring the health of your product experience and the quality of your customer acquisition and retention functions. But, they don’t offer any useful insights behind your performance so you can either double down or change your strategy.
And that’s why retention analysis matters: it breaks down customer retention metrics and shows product teams and engineers the why behind the what so they can filter signal from noise and focus on high-return activities.
Retention analysis requires observing customer trends and engagement patterns over their lifetime to detect trigger events (and non-events, i.e., unmet expectations) that could have been the last straw for your customers. That way, you can understand, to a significant degree, why your customers are churning.
On the surface, customer churn simply refers to the number (and percentage, by extension) of your customers who quit using your product/service over a specific timeframe. In practical terms, the reasons they might churn are numerous, including:
As a result, retention analysis helps you plot a graph of unmet expectations, product issues, support failures, etc., that may have led customers to churn so you can fix them all collectively.
Statusbrew is a social media management platform that you can use to schedule and publish posts, track your content’s performance, and bring all your channels into one unified inbox. According to CEO, Tushar Mahajan, they were able to cut their churn rate 20% using a two-step process, namely:
For the first part, Statusbrew embedded a live chat widget on their website to make it easier for customers to reach support, and redesigned their cancellation page as a multi-option form where users could choose why they were canceling their account.
For the next step, Statusbrew built an integration to receive cancellation notifications via Slack, so they could kick off conversations with customers via live chat (Intercom), and follow up churned users via email.
That significant retention spike wouldn’t have been possible if Statusbrew didn’t create a channel to track subscription cancellations in real-time and try to re-engage disgruntled users immediately after the fact—and that’s why retention analysis matters. It helps you uncover patterns in your customer retention history so you quickly target churned users with re-engagement campaigns and adjust your product/growth strategy for the future.
In practice, retention analysis boils down to:
This section will break down how these steps work, especially for growth-stage software companies.
Keeping tabs on net customer retention/churn over a typical period of time is the first step of proactive retention analysis since it helps you determine whether your current customer trends are favorable and whether you should be working to stabilize or turn the situation around.
To calculate your retention rate, divide the number of active users you retained at the end of a specific period of time by the total number of users you had at the start of that time period.
Formula: No. of Active Users (At Term’s End)/No. Of Active users (At Start) *100
Shortlist a handful of metrics that can reliably mirror customer retention trends, such as:
These metrics will serve as proxies for measuring your product’s retention economics from different angles and tracking churn trends, down to why and how they originate.
Note the term hypothesis: You’re only assuming these variables are potential triggers until you can adjust them and test extensively to determine whether they’re what you’re looking for.
In product management/growth parlance, a cohort refers to a group of users who share common characteristics, usually tracked over a specific period. For instance, they might have signed up, upgraded to a paid plan, stopped using your product, navigated to your landing page via a specific channel, etc.
So, grouping users who share some common attributes gives you a baseline to measure their behavior against to find possible triggers that might have led to certain patterns in their behavior.
When you start digging deeper into the data, you’ll realize significant (let’s say >10%) movements in customer retention trends are preceded by measurable changes either in your product experience, acquisition strategy, onboarding, pricing, target demographics, marketing channels, etc—that is, churn/customer retention doesn’t happen in a vacuum, and once you can isolate the variables that trigger them, you can manage churn and increase your customer retention rate predictably.
For instance, you might notice that users who:
These users usually have above-average churn rates. Based on that data, you can easily assume the hypothesis that these variables are connected to your retention performance, especially if historical data shows that they have a recurring impact on your customer churn rate.
Once you’ve formed a handful of likely hypotheses that might have impacted your retention rate, the next step is to test the impact the variable in question has on your churn by adjusting (i.e., reducing or increasing, with different speeds) it as required.
For example, if your customer churn increases by 30% immediately after a redesign of your onboarding tour, you can conduct a split test, showing different groups of new users different variations of your onboarding experience (i.e., the old vs. new) to determine if it has a material effect on retention.
That way, you can experiment and eliminate any variable that doesn’t directly impact your churn rate as you get closer to the truth.
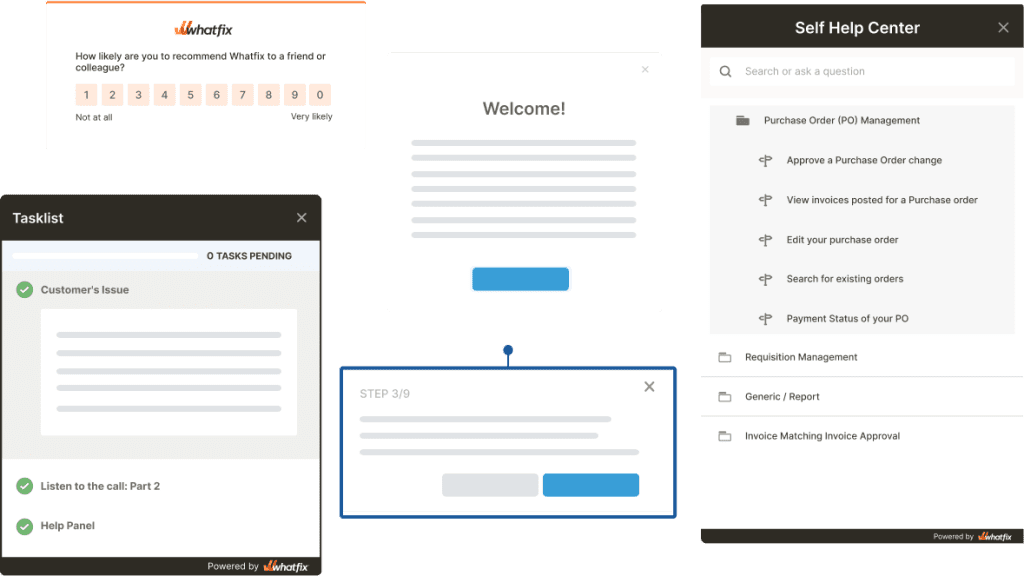
Talk to clients and end-users to gather customer feedback. Conduct 1:1 interviews with product experts, implement in-app surveys, questionnaires, and polls, and use indirect product analytics methods like session replays and heatmaps to observe your product user experience from the customer’s perspective.
Whatfix is a full-stack product experience platform designed to help product teams/growth engineers/marketers deliver better user experiences via—


Thank you for subscribing!