nderstanding different data points, their meaning, and how to utilize them can be confusing. How do product managers and data operations teams track the right product analytics and business metrics to understand an organization’s health?
One way to categorize product and business metrics is to examine whether they predict future outcomes (leading indicators) or measure past outcomes (lagging indicators). In this article, we’ll explore leading and lagging indicators in-depth and learn how to use them to inform your product strategy, improve core business metrics, and build better products.
What Is a Leading Indicator?
Leading indicators are user behavior data that are used to predict future outcomes. They are data points that quantify patterns and behaviors to tell you what will likely happen next.
Most of your key user behavior metrics that don’t directly measure revenue and retention probably fall into this category, because they tell you which user behaviors are most highly correlated with business goals like revenue and retention.
For example, you might be measuring average sessions per month. Suppose you see that users with more sessions per month on average are more likely to upgrade their accounts and have a higher lifetime value. In that case, you will use this leading indicator to guide developing new product initiatives that increase users’ sessions in a given month.
What are the benefits of tracking leading indicators?
The primary value of tracking, and reacting to, leading indicators is that it allows product teams to connect user behavior to business success. If you know which behaviors within your platform are most likely to influence your lagging indicators – usually your business goals, like revenue and retention – you can create a product roadmap that will positively impact your business goals.
A good thought exercise to drive home the importance of leading indicators is to imagine a world without them. Imagine that every morning, you checked your data dashboard and all you saw were business results: how much money you’re making and how long your users have been sticking around. You wouldn’t know what users were doing on the platform, and which behaviors mainly were likely to result in better revenue and retention.
In this reality, your product roadmap would be a series of random, uninformed initiatives to increase your business success. Luckily, this is just a thought exercise, and your leading indicators are available in Whatfix Product Analytics so that your product initiatives can be data-informed.
10 examples of leading indicators
While the leading indicators you measure depend on your specific platform, you can start with this list of common indicators often correlated with impacting your business KPIs.
- Average session time: A user’s average time on your platform in a given session.
- The average number of times a specific action is completed: If your platform allows users to generate reports, you may choose to measure the average number of reports a user generates each week.
- Time to user activation: How much time passes between when users begin using your platform until they complete a specific action.
- Time-to-value: The average amount of time it takes users to go from onboarding to generating value from your platform.
- Number of sessions per user: How many times a user logs in and utilizes your platform during a given period
- Conversion rate: Assuming your platform has a free trial or a free version, the conversion rate measures the % of users who move on to a paid version.
- Net Promoter Score (NPS): A standard metric that measures how likely a user is to recommend your platform to a friend or colleague.
- Dropoff rate: The percent of users who drop out of a specific series of actions or product flow.
- Support ticket rate: The percent of stuck users and contact your support team for help.
- Customer lifetime value (CLTV): Predicts the revenue you’ll make for each user’s tenure on your platform.
- Marketing generated pipeline volume: The amount of leads that your marketing campaigns generated in a given period
What Is a Lagging Indicator?
Lagging indicators are data points that measure concrete outcomes. Rather than being predictive, like leading indicators, they tell the story of what happened.
Typically, lagging indicators are related to revenue and retention. The company often uses these metrics to articulate its business goals and measure organizational success. For example, Annual Recurring Revenue (ARR) is the total revenue your company generates in a year.
What are the benefits of tracking lagging indicators?
Your company’s lagging indicators tell you the total of your product and marketing initiatives: are you doing things that ultimately impact your business goals as you’d hoped?
When you track these indicators meticulously, you and everyone at your organization know where you stand in terms of growth and business success. Looking at your progress frequently gives your team time to strategize and react before key periods in the business timeline, like the end of a quarter or the end of a year.
What are the disadvantages of lagging indicators?
While lagging indicators give you the bottom line of your business’s performance, they provide little actionable information. For example, you may know from your lagging indicators that your team is behind where they’d like to be in terms of revenue for Q1, but from those lagging indicators alone, you don’t know how to improve the situation.
Another downside of lagging indicators—as suggested by their name—is that they often take a long time to measure. Since you’re looking at actual outcomes, you won’t always know how you’re doing definitively fast or in real-time.
To mitigate these disadvantages, you’ll need to utilize your lagging indicators in conjunction with your leading indicators—and later in this guide, we’ll discuss exactly how to do just that.
10 examples of lagging indicators
- Annual recurring revenue (ARR) or monthly recurring revenue (MRR): How much total revenue generated in a year or month.
- Average revenue per user (ARPU): The average revenue each user generates for your company.
- Daily active users (DAUs) or monthly active users (MAUs): How many active users on your platform within a day or within a month.
- Weekly, monthly, and yearly retention: Basic retention metrics that measure what percentage of your users stay on the platform in a given period
- Weekly, monthly, and yearly paid retention: Measures the percentage of users who stick around – and keep paying – within a given period.
- Customer churn rate: The percentage of customers who leave or stop paying for the platform within a given period.
- Sales cycle length: The average amount of time to convert paying users.
- Customer acquisition cost (CAC): Average cost to acquire each new customer.
- Marketing generated revenue: The amount of revenue generated by your various marketing initiatives.
- Renewal rate: What percent of your users renew their subscription after the initial period ended.Year-over-year (YoY) revenue growth: The percentage of growth in revenue that your company generates from one year to the next
How to Blend Leading and Lagging Indicators to Work Together
Now you know that leading and lagging indicators have pros and cons, and the best way to ensure your product strategy is data-driven and set up for success is to use them together. But how do you do that?
Overall, we recommend a three-step approach:
Step 1: Establish which leading indicators (user behaviors) strongly correlate with positive or negative lagging indicators (business KPIs). Once you understand how user behavior is connected to better business results, you can move on to the next step. You can use product analytics software like Whatfix Product Analytics to track and analyze these metrics in one place.
Step 2: Optimize your product iterations to influence your leading indicators and measure them quickly. Each time you release a new product change, you should use your user behavior metrics to understand what’s working and what’s not. You should make the call as to the results of an experiment, for example, by whether or not they’re positively influencing the leading indicators that you know ultimately correlate with a positive influence on lagging indicators.
Step 3: Check your lagging indicators often to understand your overall success and catch problems as they arise. Although your leading indicators will allow you to make product decisions quickly, you’ll need to stay on top of your lagging indicators to ensure that the sum total of your product efforts is leading to the business results that you expected.
Let’s look at examples of how this all comes together in practice.
3 examples of using leading and lagging indicators together
- Marketing-generated pipeline volume (leading) + marketing-generated revenue (lagging): You’ve likely identified that a higher volume of leads in your pipeline correlates with more revenue. When you initiate new marketing initiatives, you’ll ensure that each project positively influences your pipeline volume (leading) and monitor your revenue (lagging) to ensure you’re on the right track.
- Conversion rate (leading) + average revenue per user (lagging): If you know that a higher conversion rate correlates with higher average revenue per user, you’ll ensure that all new product initiatives increase, not decrease, the rate at which your users convert. You’ll do this experiment-by-experiment and simultaneously stay on top of your ARPU to ensure that your iterations add up to the business outcome of more revenue per user.
- Net Promoter Score (leading) + customer churn rate (lagging): If you continuously measure the impact of essential product initiatives on your NPS and ensure that what you’re implementing increases customer satisfaction, you can then use the lagging metric of your churn rate to ensure that these leaps in customer satisfaction are resulting in fewer customers leaving the platform.
Use your leading indicators to move fast in product and marketing, and check your work with your lagging indicators to see the overall value from a business perspective.
Track, analyze, and improve leading and lagging indicators with Whatfix
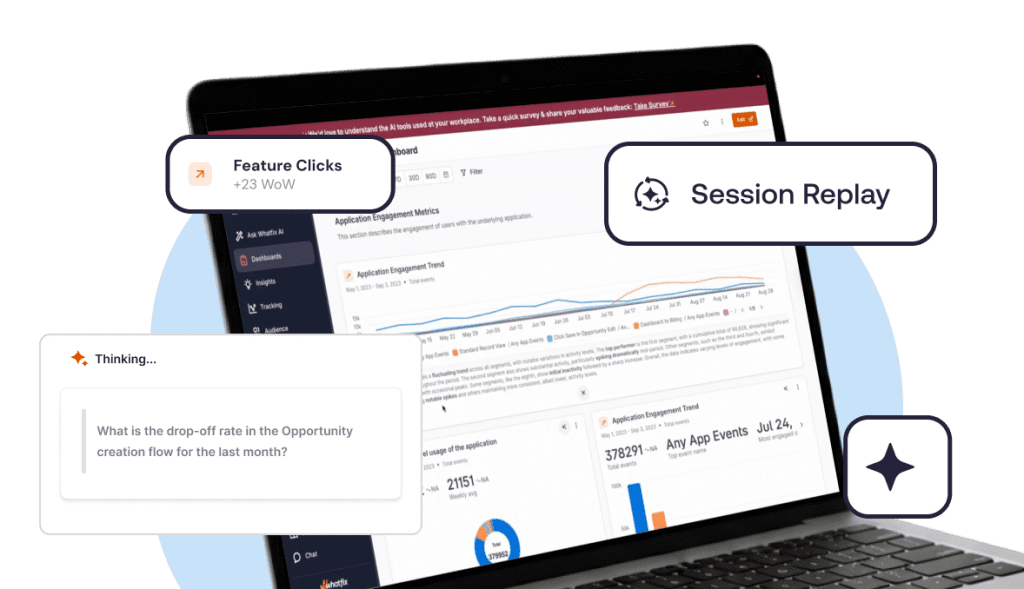
Whatfix Product Analytics provides a no-code event tracking solution to track any custom event or user action, without technical dependencies. With a tool like Whatfix, organizations are enabled with a no-code way to track custom events and understand leading and lagging indicators to ensure you’re tracking everything you need for a data-driven, user-centered strategy.
Here are two of the main ways that you can use Whatfix Product Analytics to dive deeper into your understanding when it comes to all of your metrics:
- Use Funnels and Journeys to map how users move through a process and identify where and why friction occurs. This is a detailed way of looking at your real-time leading indicators for every product initiative. Once you understan where users hit problem spots or drop out of a flow, you can optimize precisely where you need to.
- Compare groups of users or departments against each other with Cohorts. Since most platforms don’t have one monolithic group of users, you can use Whatfix Product Analytics to look at your analytics by segmenting users and initiatives. You may notice, for example, that your leading indicators for a specific product iteration are positive for one cohort of users, but neutral or negative for another. Monitoring in detail allows you to personalize the experience for different groups of users to the benefit of all of your key indicators.

Once you’ve nailed down what you’re monitoring and how you’re ready to utilize the Whatfix DAP to react to what you’ve observed and make a significant impact on your user experience and your business KPIs in tandem, here are some ways to do just that:
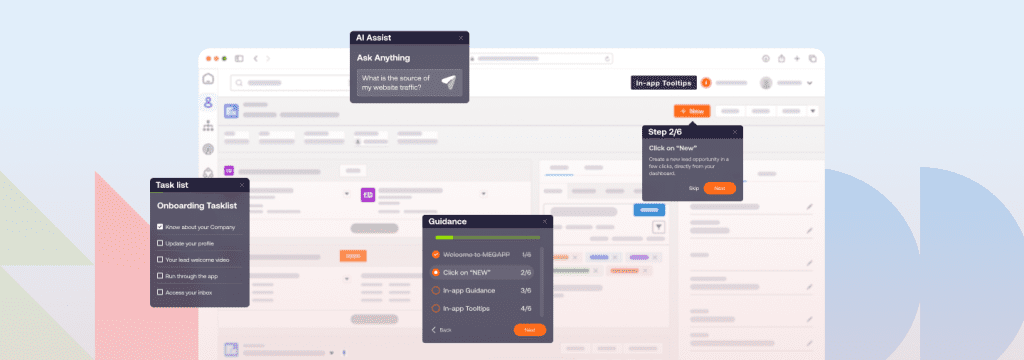
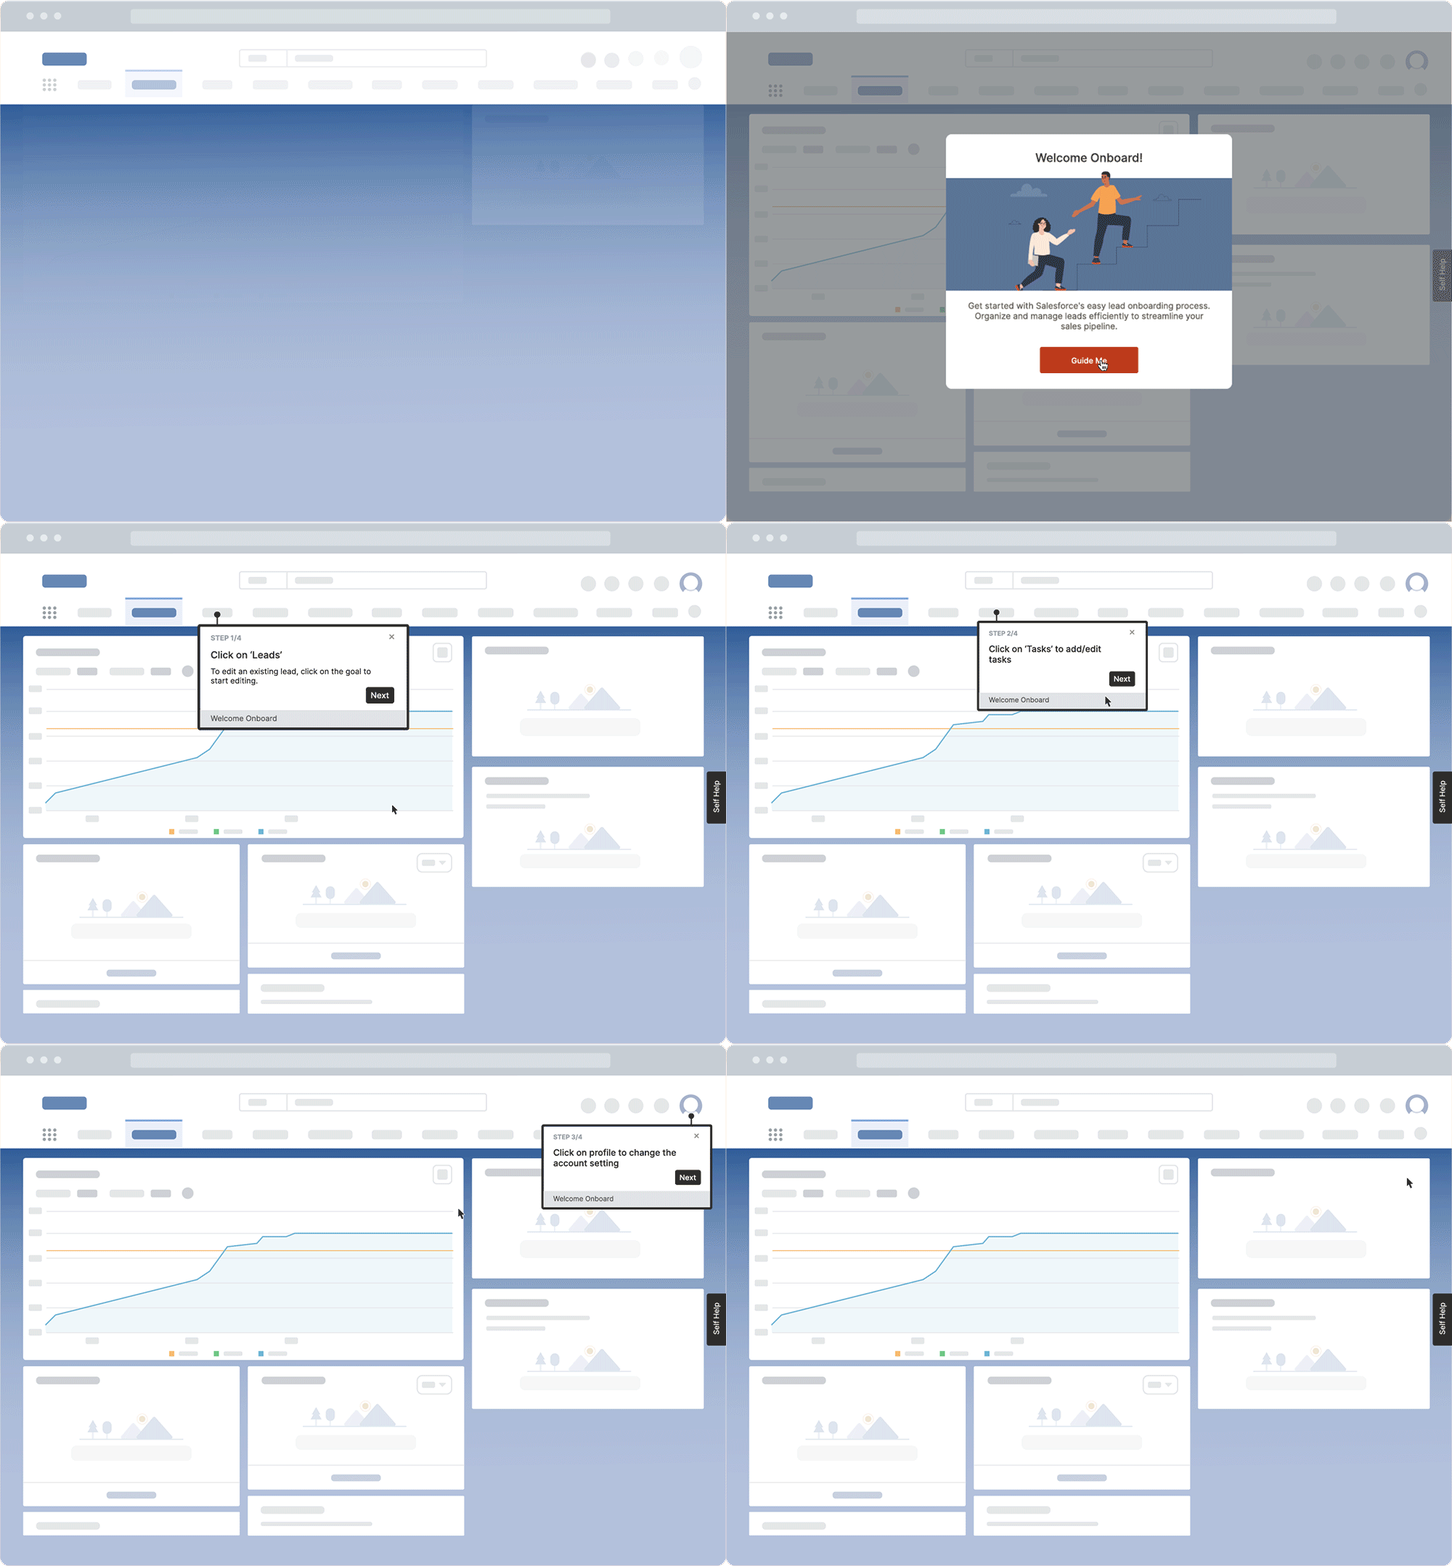
- Enable users with in-app guidance and support in the flow of work to overcome digital friction. Don’t let friction slow your leading indicators and limit the impact on your lagging indicators – use this strategy to allow users to move forward seamlessly.
- Accelerate time-to-proficiency with Tours and Task Lists. The leading metric of how quickly users know their way around your platform likely influences all of your key lagging indicators and business KPIs. Use tours and task lists to turn your users into proficient platform experts faster.
- Use Flows to guide users through complex processes or infrequently done tasks. When monitoring your leading indicators, you’re likely to see complicated flows or edge cases where users tend to drop off or indicate dissatisfaction. By using Flows in the Whatfix DAP, you can guide users through these processes and reap the benefits in both your leading and lagging indicators.
- Create Smart Tips to provide additional information or nudge users to take specific action. Among your key leading indicators, you’ve probably already established that some particular actions will likely have positive outcomes and correlate positively with your lagging indicators. Use Smart Tips to give users context and encourage their usage of these actions in real-time.
- Overcome technical issues and transfer knowledge with Self Help, an in-app resource center that overlays your enterprise software and integrates with your knowledge repositories. Technical problems can make it look like a product initiative wasn’t successful, even if it had potential. By using Self-Help and letting your users solve issues as soon as they encounter them, you increase the chances that they move through the flow and get value – which you’re likely to see in the data.
Are you ready to use your leading and lagging indicators in tandem for a data-driven, successful product and marketing strategy? Schedule your Whatfix demo today!
