
")
")
")

Forrester estimates that mid-sized firms (around 1,000 employees) lose $10.9M annually due to ineffective digital adoption, and that workforces spend roughly 728 hours per employee navigating poorly adopted or complex digital environments.
Whatfix’s 2026 State of Enterprise Digital Transformation ROI report highlights the upside of closing the digital adoption gap at the workflow level with a digital adoption platform (DAP). It found that organizations using a DAP report:
- 64% faster time-to-value on digital investments
- 37% higher user proficiency after three months
- 67% higher ROI on enterprise software
Enterprise software does not create value at deployment. It creates value when employees, managers, partners, and customers can execute critical workflows correctly and consistently in production.
That makes digital adoption a strategic operating priority for any organization investing in transformation. Companies that build this capability move faster, reduce friction, and realize more value from their systems. Companies that do not leave ROI trapped inside the software they already bought.
This guide is for digital adoption program owners, CIO staff, enterprise application owners, and transformation leaders who need to build a business case for digital adoption and design an operating model that can scale. It explains how to launch a focused pilot, prove measurable impact, and expand into a multi-application digital adoption strategy across the enterprise.

What an Enterprise Digital Adoption Strategy Does
Digital adoption strategies act as an operating model that improves workflow execution inside live enterprise systems and stays current through releases. In the enterprise, it should be run like an operational function: prioritize the workflows that matter most, intervene where execution breaks down, and measure whether performance improves.
A mature digital adoption program typically owns five core responsibilities:
- Workflow prioritization: It identifies the workflows that matter most based on business impact, user friction, compliance risk, support burden, or downstream error costs.
- Execution support in the flow of work: It helps users complete tasks correctly inside the application with contextual guidance, prompts, validation, and self-service support.
- Readiness for high-risk scenarios: It gives users a safe environment to practice critical workflows before entering production when the cost of mistakes is high.
- Governance and content operations: It manages content approvals, QA, release windows, localization, versioning, and retirement with the discipline required to stay credible at enterprise scale.
- Outcome measurement: It tracks workflow performance, identifies where friction is concentrated, and pinpoints which cohorts need intervention.
In large organizations, digital adoption works best as the enablement and measurement layer for workflow execution across enterprise systems. That is what allows teams to improve proficiency, reduce friction, and prove software value through business outcomes.

Digital Adoption vs. Training vs. Change Management
Training matters. Change management matters. Neither one carries the full load once users are in production.
Training prepares people with knowledge, process understanding, and readiness before or around a rollout. Change management builds awareness, alignment, stakeholder buy-in, and reinforcement. Digital adoption handles execution in the flow of work.
| Approach | What it produces | What it proves in production | Where it breaks at enterprise scale |
| Training programs | Courses, sessions, job aids, certifications, completion records | Knowledge exposure and preparedness signals | Content becomes stale after releases. Attendance and completion do not confirm correct execution on real workflows |
| Change management programs | Communications plans, stakeholder alignment, reinforcement campaigns, readiness activities | Awareness and adoption intent signals | Messaging does not fix workflow friction. Resistance often persists when users hit broken steps, permissions issues, or unclear exception paths |
| Digital adoption program | In-app guidance, contextual self-service support, workflow instrumentation, governance and release cadence, executive scorecards | Improved task completion, faster proficiency, fewer tickets, fewer exceptions, stronger adherence | Breaks when ownership is unclear, governance gates are missing, or measurement is not tied to systems of record |
The Digital Adoption Business Case for Large Organizations
At enterprise scale, “adoption” isn’t a soft initiative. It’s the difference between a software investment that improves throughput and one that creates a permanent support and rework tax. A business case that gets approved ties digital adoption to workflow economics, then proves it fast with a pilot that produces baseline-to-movement evidence.
Why now is the time to establish a digital adoption program
Modern enterprises run on multi-app stacks with continuous releases and high role variance. That combination creates drift. Even when the rollout is executed well, users fall back to old paths, exception handling gets inconsistent, and localized workarounds quietly become the process.
That drift becomes an operational cost.
Workflow friction shows up as ticket volume that never resets, exceptions that increase manual effort, rework that slows cycle time, and compliance exposure when controlled steps are bypassed or completed incorrectly.
Finance leaders and CIOs approve a digital adoption budget when the business case is structured like an operating plan. It needs a measurable baseline, a time-bound target, and an accountable owner who can ship changes in production and enforce governance.
The fastest way to prove the model is a 90-day pilot that starts narrow, ships interventions on the highest-friction steps, and validates progress against outcome KPIs derived from systems of record.
The triggers and signals that uncover a digital adoption problem
If any of the triggers below are true in your environment, you already have the starting point for a defensible business case. Each one incurs immediate costs, and each has data that can be baselined and improved within a quarter.
| Trigger or symptom | Workflow impacted | Where the data lives | The business impact |
| New software rollout or major workflow launch | New submission, approval, validation, or routing steps in the live workflow | App telemetry or workflow analytics, ITSM ticket categories, workflow exception logs | Cycle-time drag, increased exceptions and rework, elevated ticket volume, slower time-to-proficiency for impacted cohorts |
| Release-driven spike in tickets | Validation errors, approval routing, navigation changes | ITSM ticket categories, release notes, workflow funnels | SLA risk, backlog growth, productivity loss during change windows |
| Audit exceptions rising | Required fields, attestations, approvals | Audit findings, exception logs, compliance reporting | Remediation effort, policy risk, delayed approvals, control failures |
| Role-change ramp time | Manager self-service, HR workflows, finance approvals | Task completion reporting, ITSM tickets per cohort, onboarding metrics | Manager time loss, repeated errors from low-context users, elevated support demand |
| Workarounds proliferating | Shadow spreadsheets, email approvals, duplicate entry | Exception queues, cycle time reports, reconciliation data | Data quality degradation, duplicate work, slower handoffs, leakage risk |
The outcomes of a strong digital adoption operating model
A digital adoption operating model is funded when outcomes are measurable and defensible. The headline proof should come from operational KPIs tied to cost, speed, quality, and risk. Activity metrics still matter, but they belong in the supporting layer that explains why the outcome moved.
Outcome KPI families that survive scrutiny
| KPI family | Example metrics | Primary data source | Decision it supports |
| Productivity | Time-to-proficiency, task completion time, cycle time | Workflow analytics, app logs, time studies where needed | Whether the investment is unlocking capacity and improving throughput |
| Support | Tickets per active user, Tier-1 deflection rate, repeat ticket drivers | ITSM reporting, self-service analytics | Whether the organization is reducing dependency on support and containing change disruption |
| Quality | Error rate, exceptions, rework rate, first-pass yield | Exception queues, QA sampling, workflow validation logs | Whether the new path is being executed correctly and reducing downstream correction cost |
| Compliance | Process adherence, audit exceptions | GRC systems, audit reports, workflow path analysis | Whether controlled workflows are being followed and risk is trending down |
Who’s Responsibility Is Digital Adoption?
In the enterprise, workflow performance always has an owner. The org chart might spread accountability across committees, but the work still lands somewhere when approvals stall, exceptions rise, or ticket volume spikes after a release. A digital adoption program works when ownership is explicit enough to ship fixes, govern changes, and prove movement on outcome KPIs.
The minimum ownership model looks like this:
- Digital adoption program owner: Runs the operating cadence, defines standards, owns intake and prioritization, and publishes the executive scorecard. This is the person accountable for turning adoption into a repeatable program, not a set of one-off requests.
- Enterprise application owner: Owns releases, environment constraints, and workflow performance inside the application. This role is essential because the program has to stay current through change windows and configuration updates.
- Process owner when required: For controlled workflows, you need the person who owns controls, exceptions, and compliance proof. Without this role, approval gates get vague and adherence becomes optional.
This ownership prevents the three failure modes that derail enterprise programs: content sprawl, weak measurement, and approvals that stall because no one has authority to decide what ships.
Buyer groups
A digital adoption program often is blocked when stakeholders can’t see the proof they need, in the format they expect, at the moment they are asked to approve. Use the buying table below (or jump to our DAP RFP and buyer’s scorecard guide) to run approvals with fewer loops and include the right stakeholders in your digital adoption business case:
| Buying group role | Example titles | What they need to see to approve | Common objections |
| Economic buyer (decision maker) | CIO, VP IT, VP Enterprise Apps, VP Digital Transformation | Baseline, time-bound target, payback model, governance and risk controls, scale plan beyond one app | “Prove payback inside a quarter or two.”
“We already have training.” |
| Champion (program owner) | Digital adoption program lead, enterprise application owner | A pilot plan they can run, clear operating cadence, standards for intake, QA, approvals, and reporting | “This will become content sprawl.”
“We cannot keep it current.” |
| Application owners and operators | Salesforce product owner, Workday HRIS owner, SAP program lead, app admins | Deployment model clarity, release discipline, environment constraints, who approves what, rollback rules | “This will slow releases.”
“We cannot disrupt production.” |
| Technical evaluators | Security, privacy, enterprise architecture, analytics lead, ITSM admin | Data handling and access controls, auditability, instrumentation plan, evidence pack readiness | “What data is captured?”
“How do we control publishing and access?” |
| Other influencers | Service desk leadership, compliance, PMO, change leaders, L&D | Ticket containment plan, audit readiness, reinforcement plan, proficiency proof for target cohorts | “This duplicates change work.”
“Support will still get flooded.” |
How to Build a Digital Adoption Strategy, from Pilot to Expansion
A pilot is the minimum viable product and the first runnable instance of your digital adoption strategy, intended to prove value and eventually scale across the enterprise.
The goal is simple: prove measurable movement on one workflow outcome KPI, then earn expansion approval to build a digital adoption function, invest in a DAP, and scale across multiple applications with proven evidence, not optimism and theory.
Step 1: Select the pilot application and workflows
Start by forcing specificity. The fastest pilots pick an application where the cost of friction is already measurable, and the owners are ready to run a cadence, not just approve a kickoff.
Application selection criteria
- Business criticality: Workflows tied to revenue, cost, risk, or capacity.
- Change frequency: Releases and policy updates often create enough drift to justify an operating model.
- Ticket volume: Support demand is already visible and categorized.
- Error cost: Exceptions, reversals, rework, or downstream reconciliation are measurable.
- Compliance exposure: Controlled steps cannot drift without audit risk.
- Stakeholder readiness: The app owner, program owner, and process owner can agree on KPIs and approval gates within the first two weeks.
Once the application is chosen, narrow the pilot to two to three high-volume or high-risk workflows. Avoid “broad adoption” pilots. You want a small number of paths where outcome movement can be proven quickly.
Workflow selection rubric
- Volume: How many users and transactions run through the workflow.
- Risk: Compliance exposure, financial impact, downstream dependency.
- Time wasted: Where users stall, abandon, or take long paths.
- Ticket drivers: Steps that generate repeat support demand.
- Downstream error cost: Where mistakes create exceptions and rework.
Output: A ranked workflow list with a one-paragraph “why this workflow” justification for each. Treat this as an appendix artifact you can reuse with finance, security, and app leadership.
| Workflow | Impact (1-5) | Effort (1-5) | Primary KPI |
| Purchase requisition submission and approval | 5 | 3 | Cycle time or process adherence |
| Invoice submission and exception resolution | 5 | 4 | Exception rate |
| Employee access request submission and routing | 4 | 2 | Tickets per active user or Tier-1 deflection rate |
Why did we select these three workflows to use in the pilot?
Workflow 1: Purchase requisition submission and approval: This is a strong pilot workflow because it is high-volume, spans multiple roles, and the cost of friction shows up fast in cycle time and policy adherence. It also tends to be a controlled path, so execution gaps create real risk through bypassed approvals and inconsistent required fields. Measurement is straightforward with clear start and end points and observable step-level drop-offs. In 90 days, hot-step guidance and reinforcement on required steps should produce measurable movement quickly.
Workflow 2: Invoice submission and exception resolution: This workflow is ideal when exceptions and rework are already consuming capacity. Exception volume is expensive and visible, and “correct execution” can be defined and validated cleanly from systems of record. That makes it easy to baseline and prove improvement without debate. In 90 days, targeted support on the failure steps and exception paths should reduce exception rate and rework, then show the impact in trend data.
Workflow 3: Employee access request submission and routing: This workflow is a reliable pilot for support containment because tickets, misrouting, and SLA impact are immediate and easy to quantify. It typically has repeatable drivers, which makes it well-suited for contextual self-service and step-level guidance. It also scales well to other request-based workflows once the model works. In 90 days, you should be able to reduce tickets per active user and increase Tier-1 deflection with clear week-over-week proof.
Step 2: Lock success statements executives will accept
A digital adoption pilot stalls when “success” is defined as general usage. Executives fund programs when success is written as an operational outcome with an accountable owner and a time-bound target. Lock this in before you build content, before you instrument analytics, and before you schedule your first steering meeting.
Use this template and keep it tied to a specific workflow and cohort:
This pilot is owned by the [workflow owner role] and success means moving [outcome KPI] by [target] within [time window] on [named workflows] for [target cohorts].
Example 1: ERP finance or procurement workflow: This pilot is owned by the Procure-to-Pay process owner and success means moving invoice exception rate down by 15% within 90 days on invoice entry and exception handling for AP processors and approvers.
Example 2: ITSM service request workflow: This pilot is owned by the Service Desk Manager and success means moving Tier-1 deflection rate up by 20% within 60 days on service request submission and routing for employees submitting access and software requests.
Step 3: Build a measurement plan that survives scrutiny
Build the measurement plan the same way finance will evaluate it: one primary outcome KPI, a small set of supporting KPIs that explain why it moved, and segmentation that target key cohorts and helps protect against false positives.
How to select primary and supporting KPIs
Pick the primary KPI that best represents the workflow’s business impact. For many pilots, that is, tickets per active user for support-heavy workflows or time-to-proficiency for onboarding and role-change workflows.
For primary KPIs, choose metrics that can be measured from systems of record within the first month. If you can’t validate it in 30 days, don’t headline it.
Then, choose three to six supporting KPIs tied directly to execution:
- Workflow completion rate on the critical path
- Step-level drop-offs at the hot step
- Error or exception rate for workflows with correction cost
- Tier-1 deflection rate and repeat ticket drivers for support-heavy workflows
- Process adherence for controlled steps
Segmentation requirements
Segment your users into cohorts on day one. This helps target at-risk and key cohorts, and prevents data from hiding under the radar.
Application owners should consider segmentation like:
- Business department (ie. sales, marketing, support, finance, etc.)
- Role type or level (ie. manager vs. end-user in an HCM, account manager vs. admin in a CRM)
- Region (ie. to provide correct taxonomies and translations)
How to set a baseline
In your first few weeks, you’ll need to benchmark your KPIs to have a number to compare against. The following tips will help you get started:
- Instrument the workflow steps you’ll measure and lock event naming.
- Pull two weeks of ticket categories and map top drivers to workflow steps.
- For error and exception metrics, use system logs where available and add targeted sampling where needed.
- Baseline excludes training completion. It doesn’t correlate reliably with production execution.
Then create decision rules to help make decisions:
- Week 1 signals tell you what to ship next: Repeat ticket clusters, top drop-offs, cohort variance.
- Week 4 validation is where you prove impact: Tickets per active user trending down, deflection trending up, drop-offs declining, exceptions shrinking, adherence improving.
| KPI | Operational definition | Segmentation cuts | Pilot target |
| Tickets per active user | Tickets attributed to the pilot app divided by monthly active users | Role, region, tenure | Reduce by 15% to 30% on pilot cohorts |
| Tier-1 deflection rate | Share of Tier-1 issues resolved without agent involvement | Role, region, ticket category | Increase by 20% |
| Workflow completion rate | Percent who start and complete the workflow on the intended path | Role, region, tenure | Increase by 10% to 20% |
| Hot-step drop-off | Percent who abandon at the highest-friction step | Role, region, tenure, environment when relevant | Reduce by 10% to 25% |
| Error or exception rate | Percent of transactions requiring correction or routed to exceptions | Role, region, transaction type | Reduce by 10% to 20% |
| Time-to-proficiency | Median days until users complete workflows unaided within acceptable error thresholds | Role, region, tenure | Reduce by 25% |
| Process adherence | Percent completing required fields, approvals, and attestations correctly | Role, region | Improve adherence and reduce exceptions |
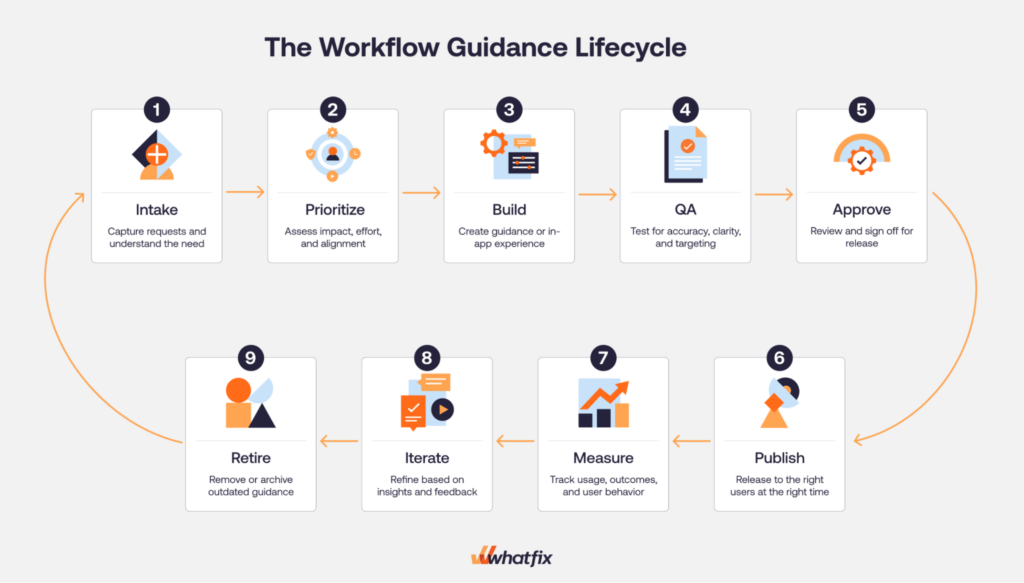
Step 4: Ship enablement across the workflow lifecycle
A pilot proves value when it ships enablement where work breaks down. That means covering the workflow before production for high-risk scenarios, inside production for day-to-day task completion, and after release moments when users need fast answers without opening tickets. Then you run the loop until the KPI moves.
Readiness and practice before production for high-risk workflows
Use practice when mistakes carry real cost. Controlled finance and procurement steps, clinical documentation, claims processing, and any workflow where errors trigger exceptions and rework.
Digital adoption leaders can ensure this by creating application sandboxes for user training that provide hands-on experience before real application use. With a platform like Whatfix Mirror, easily create cloned applications with a no-code editor. Pair with AI roleplay and guided workflows to create truely immersive experiences that drive knowledge retention and prepare users before live work.

The goal is to ensure readiness for the exact paths users will run, including exception handling. Define a readiness threshold that’s easy to defend, such as a pass rate on the critical workflow and time-to-complete within an acceptable range. The faster you can achieve this, the faster you’ll realize outcomes from your workflows.
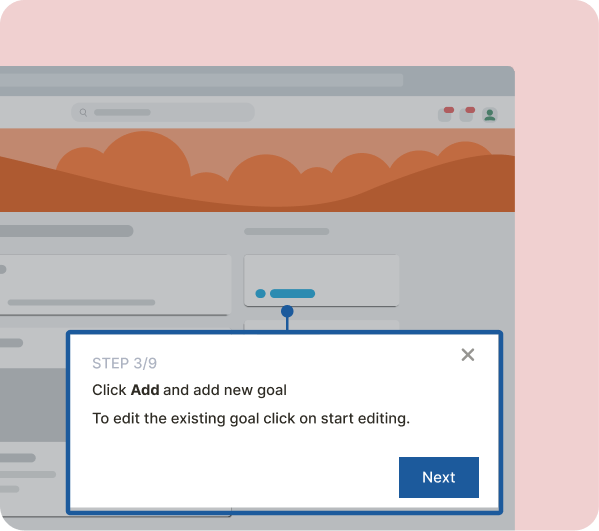
In-workflow guidance for task completion and error prevention
Launch in-app guidance on the steps driving drop-offs, errors, and support demand. Start with guided task flows for the critical path, then add reinforcement at the hot step where users fail. Use validation support and field-level guidance when error cost is high.
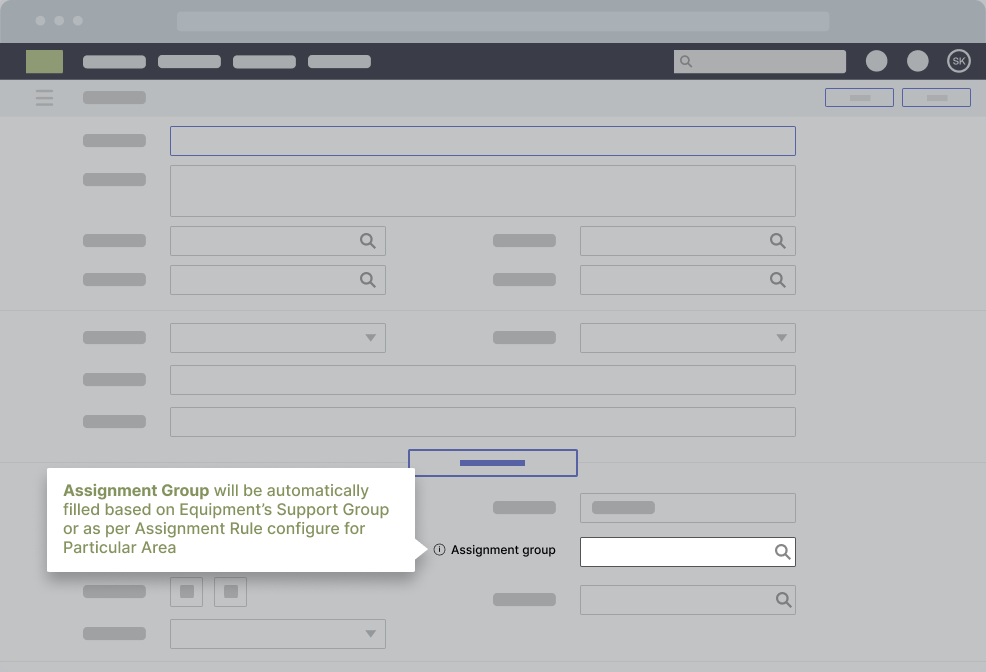
Keep the coverage tied to the outcome KPI. If the primary KPI is tickets per active user, prioritize the steps generating repeat tickets. If the primary KPI is exception rate, prioritize the steps generating reversals and rework.
Self-service support that deflects repeat issues and routes true defects cleanly
Treat self-service as a containment strategy. Deflect the repeat “how do I” and “what changed” issues in context, at the moment of failure. Reserve escalation for access failures, true system defects, and policy exceptions that require owner review.
Build a simple issue catalog for the pilot so every deflection asset maps to a ticket driver, a workflow step, and an owner.
Closed-loop optimization cadence
Run the program as a weekly loop:
- Identify friction from workflow drop-offs, cohort variance, and ticket drivers.
- Ship the smallest intervention that removes the failure mode.
- Validate movement with week 1 signals and week 4 proof.
- Iterate or retire interventions that do not move the KPI.
A pilot doesn’t need perfect coverage, but it does need a repeatable shipping cadence that improves execution on priority workflows and proves movement that finance will accept.
Step 5: Set DAP governance and content operations that scale
A DAP pilot earns trust when it shows control. DAP content governance is how you keep enablement accurate, auditable, and current through releases. It’s also what prevents the pilot from turning into an endless queue of one-off requests.
Start with a clear intake model. Your intake sources should be explicit so the program is driven by evidence, not noise:
- App owner requests tied to upcoming releases and workflow changes
- ITSM drivers, especially repeat ticket categories and known spike patterns
- Analytics insights, including hot-step drop-offs and cohort variance
- Release notes and change logs that signal where drift will occur
Then run every request through the same prioritization rubric. Keep it simple and repeatable:
- Impact: Does this unblock a critical workflow or move the primary KPI
- Volume: How many users and transactions are affected
- Risk: Compliance exposure, financial impact, downstream dependency
- Effort: Build and validation effort, plus deployment constraints
Define QA standards and approval gates before anyone publishes. This is where enterprise programs either scale or stall.
- QA standards should cover accuracy, controlled language for regulated workflows, and localization rules where relevant.
- Approval gates should name who can publish and who must approve. If the workflow is controlled, require process owner signoff for the steps that impact compliance, approvals, or audit evidence.
Finally, lock the mechanics that keep the program stable through change:
- Publish windows: A weekly ship window for updates so releases stay predictable
- Rollback rules: What triggers a rollback, such as a spike in tickets per active user or a rise in exceptions after a change
- Versioning: Keep a clear change history so teams can audit what shipped and when
- Localization: Translation workflows, regional variance checks, and localization QA
- Environment testing realities: Plan for web, desktop, and VDI constraints, including validation windows and deployment coordination
When these controls exist, the pilot does more than ship guidance. It proves that the program can operate like an enterprise infrastructure.
Step 6: Run the operating cadence and prove it works
A digital adoption program becomes credible when it runs on a cadence that produces decisions, not status updates. The cadence is where measurement turns into shipping, and shipping turns into movement toward outcomes that executives can defend.
Weekly cadence
Treat weekly as your production rhythm. Keep it tight and consistent.
- Triage intake from app owners, ITSM drivers, analytics signals, and release notes.
- Review top friction on the priority workflows. Focus on the hot step and the cohorts still failing.
- Lock the ship plan for the week: what guidance updates, what self-service entries, what comms, what needs escalation to the app or process owner.
- Publish updates in the ship window, then run an impact check against the primary KPI and the supporting signals.
Monthly cadence
Monthly is for executive visibility and scope decisions. It should produce clear next steps, not a slide deck that no one uses.
- Publish the executive governance pack with a consistent structure: scorecard, insights, actions shipped, outcomes moved, next priorities.
- Define the decisions that must be made each month: expand workflow scope, adjust targets, fund additional localization, add readiness practice for high-risk workflows, or escalate workflow redesign.
- Set the attendees based on decision rights: program owner, app owner, service desk partner, analytics owner, and process owner for controlled workflows.
Quarterly cadence
Quarterly is where you keep the program clean and expand without sprawl.
- Refresh targets based on performance trends and upcoming release cycles.
- Consolidate overlapping guidance and retire content that is no longer used or no longer accurate.
- Re-point internal links and self-service entries so users land on the best path quickly.
- Make the expansion decision: add the next workflow set in the same app or start app 2 using the same selection rubric and measurement standards.
If the cadence is working, you’ll see it in two places: support dependency declines week over week, and the scorecard stops being a report. It becomes the mechanism that drives decisions and keeps adoption tied to operational outcomes.
| Week range | Deliverable | KPI impacted |
| Weeks 1–2 | Pilot scope locked: application, 2–3 workflows, cohorts, success statement | Baseline readiness |
| Weeks 1–2 | Measurement plan and instrumentation: event naming, segmentation, baseline capture | Completion rate, hot-step drop-off, tickets per active user |
| Weeks 1–2 | Governance gates and publish cadence: QA checklist, approvals, weekly ship window, rollback rules | Risk containment and release discipline |
| Weeks 3–4 | First hot-step coverage: guided flow for the highest-failure step in each workflow | Drop-off reduction, completion rate |
| Weeks 3–4 | First deflection coverage: Self Help for the top 3–5 repeat ticket drivers | Tier-1 deflection, tickets per active user |
| Weeks 5–6 | Targeted onboarding path for the pilot cohorts on the named workflows | Time-to-proficiency |
| Weeks 5–6 | Readiness practice for high-risk workflows (only when error cost is high) | Error rate, exceptions, adherence |
| Weeks 7–8 | Optimization cycle 1: measure friction, ship intervention updates, validate week 1 and week 4 movement | Primary KPI and supporting KPIs |
| Weeks 9–10 | Optimization cycle 2: expand coverage to the next failure steps and refine self-service triggers | Completion, drop-offs, repeat ticket drivers |
| Weeks 9–10 | Executive scorecard draft: baseline vs current vs target, segmented by cohort | Executive reporting readiness |
| Weeks 11–12 | Executive narrative pack: insights, actions shipped, outcomes moved, next priorities | Scale decision support |
| Weeks 11–12 | Scale recommendation: expand workflow set in app 1 or start app 2 with the same rubric | Portfolio ROI |
Step 7: Expand the pilot into a multi-app digital adoption operating model
A pilot earns expansion when it proves two things at once: the KPI moved and the team can repeat the work without turning the program into a backlog of one-off enablement requests.
Start with a clear scale rule. Don’t expand because the pilot feels busy or because a new stakeholder asks for coverage. Expand only when the pilot workflows are stable by cohort. That means KPI movement is sustained across the target roles and regions, repeat ticket drivers are trending down, and the hot-step drop-offs are no longer driving exceptions and rework.
When you scale, the operating model shouldn’t change. The point of a digital adoption program is that the standards carry forward.
What stays the same:
- Intake rubric and prioritization logic
- QA standards and approval gates
- Weekly ship window and rollback rules
- Scorecard format and monthly governance pack
What changes as you scale is what you are governing.
- App-specific workflow selection and sequencing
- Environment constraints for web, desktop, and VDI
- Localization requirements and regional workflow variance
- Process owner involvement when workflows are controlled and require compliance proof
The fastest way to create sprawl is to expand scope without a cap. Set simple limits and enforce them.
- Cap net-new workflows per month per app.
- Retire stale guidance as you add new coverage.
- Consolidate overlaps quarterly so users do not see competing instructions.
- Enforce naming and event tracking standards so reporting stays comparable across apps.
Make the app 2 and app 3 plan concrete. Use the same selection rubric you used for the pilot. Pick the next application based on measurable cost signals. Select 2 to 3 workflows. Baseline. Ship. Validate. Repeat. That is how a pilot becomes a portfolio program.
Examples of Enterprise Digital Adoption Programs
Let’s look at three examples of enterprise digital adoption programs. Each is powered by Whatfix, using it to standardize training, embed support in the flow of work, and turn software change into measurable business outcomes.
1. REG takes an enterprise-wide approach to application training, learning, and support
REG built its digital adoption program as a shared operating layer across core enterprise applications, not as a one-off training project for a single system.
REG standardized on Whatfix to deliver continuous, in-app learning and support across platforms like Salesforce CRM and Oracle JD Edwards ERP, replacing fragmented documentation, inconsistent training methods, and heavy reliance on in-person support.
REG uses Flows to break complex processes into guided, step-by-step task walkthroughs, Self Help to surface embedded knowledge at the moment of need, and analytics to identify adoption gaps, monitor content usage, and flag outdated behaviors when users fall back to old processes.
That enterprise-wide model created meaningful business impact: REG cut ERP and CRM time-to-proficiency by about 50%, reduced daily application-related IT support tickets by 83%, shortened new-hire ramp time by roughly three months, and reduced accounting errors by standardizing how employees complete critical workflows.
2. Sentry provides a unified digital adoption approach to nine mission-critical applications
Sentry’s digital adoption program stands out for its broad application portfolio and clear governance structure.
Sentry has gone live with Whatfix on eight applications, with additional business processes in the pipeline, supporting 2,000 employees, up to 700 external agents and customer service reps, and more than 75,000 customers. Sentry pairs that scale with a support model linking its learning Center of Excellence, Sentry University, and business stakeholders, providing a program structure rather than leaving adoption efforts scattered across teams.
Its approach combines in-app onboarding, moment-of-need support, and ongoing skills development across internal and external experiences, using Pop-Ups, Flows, Smart Tips, Beacons, user actions, awareness campaigns, and feedback loops to drive adoption.
The result is a digital adoption program tied directly to operational performance: Sentry reported about $950,000 in annual savings, a 40% reduction in content creation time, elimination of 100 daily support tickets through Self Help, and early Workday results showing 94% user engagement and 91% self-help search success.
3. Vizient focuses its digital adoption efforts on key CLM workflows
Vizient shows that an enterprise digital adoption program does not need to start broadly to deliver outsized value.
Its strategy centered on a high-risk, high-friction area within Icertis CLM, where user errors in document upload and contract handling were causing workflow disruptions, rework, slower execution, and compliance exposure.
Rather than treating the issue as a generic training gap, Vizient used Whatfix to redesign the workflow experience itself. The company deployed targeted UX improvements, role-based Smart Tips and Pop-Ups, an automated NDA Flow, and embedded Self Help connected to its SharePoint documentation so users could get guidance without leaving Icertis.
That focused workflow approach produced hard business outcomes fast: Vizient eliminated contract overwriting errors, reduced contract workflow errors by 93%, accelerated average contract execution time from 33.5 days to 14 days, saved 618 hours in admin work by reducing L1 support questions, and improved user productivity by more than 86 hours. It is a strong example of how mature digital adoption programs prioritize the workflows where user friction creates direct business risk.
Why Whatfix Is the Centerpiece of Your Digital Adoption Program
A digital adoption program is only as strong as its ability to run in production. That means three things have to work together:
- You need to see where workflows break
- You need to ship support where users get stuck
- You need governance that keeps everything current through releases
Whatfix is a digital adoption platform that sits at the center of that operating model because it combines execution support, measurement, and lifecycle control across the environments enterprises actually run.
Whatfix DAP
Whatfix DAP is the execution layer. It’s how teams support correct task completion in the moment and reduce dependency on tickets and shadow processes.
- In-workflow guidance: Ship step-by-step support on the critical path and reinforce the hot steps where users drop off or make mistakes. This is how you move time-to-proficiency, task time, completion rate, and error reduction.
- Self Help for ticket containment: Deflect repeat Tier-1 issues with contextual support, then route true defects and access issues cleanly. This is how you move tickets per active user, Tier-1 deflection, and repeat ticket drivers.
- Governance and lifecycle control: Scale requires control. Approvals, QA standards, versioning, publish windows, and rollback rules are what prevent content sprawl and keep guidance accurate through releases.
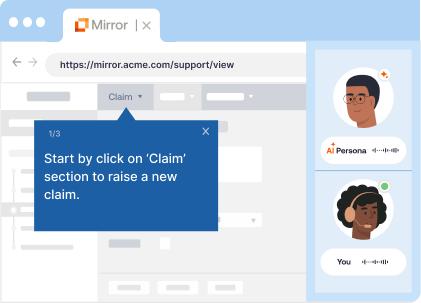
Whatfix Mirror
Whatfix Mirror supports readiness when production risk is high. Some workflows are too costly to learn through trial and error.
- Practice before production: Give users a safe environment to learn critical paths and exception handling without creating errors in live systems.
- Pair hands-on training with AI Roleplay and in-app guidance: AI roleplay provides an adaptive experience to provide scenario training, and guidance helps walk users through key steps in critical processes, driving knowledge retention.
- Readiness proof: Use pass rates and time-to-complete to validate that high-risk cohorts are ready before expansion or before the next release wave. AI assessments benchmark readiness and suggest next steps for every user.
Whatfix Product Analytics
Whatfix Product Analytics makes the scorecard defensible. It gives you a measurement layer that can baseline workflow performance, identify friction, and validate movement over time.
- Baseline and segmentation: Establish where the workflow breaks by role, region, and tenure so averages do not hide failure.
- Funnels, paths, and cohorts: Pinpoint hot steps, cohort variance, and regression after releases so prioritization is evidence-driven.
- Proof of movement: Track baseline versus current versus target and connect KPI movement to interventions shipped, which is what finance and CIO staff want to see.

Whatfix AI
AI is most valuable when it speeds up shipping without weakening controls.
- Faster authoring and updates: Accelerate content creation so teams can keep up with change cadence and hot-step fixes.
- Insight discovery: Surface emerging friction themes and summarize patterns to support prioritization.
- Human approvals remain the gate: Controlled workflows and policy language still require review and signoff. AI helps teams move faster inside the governance model.
Book a Whatfix demo to define pilot scope, baseline plan, payback inputs, and a 90-day plan tied to measurable workflow outcomes.