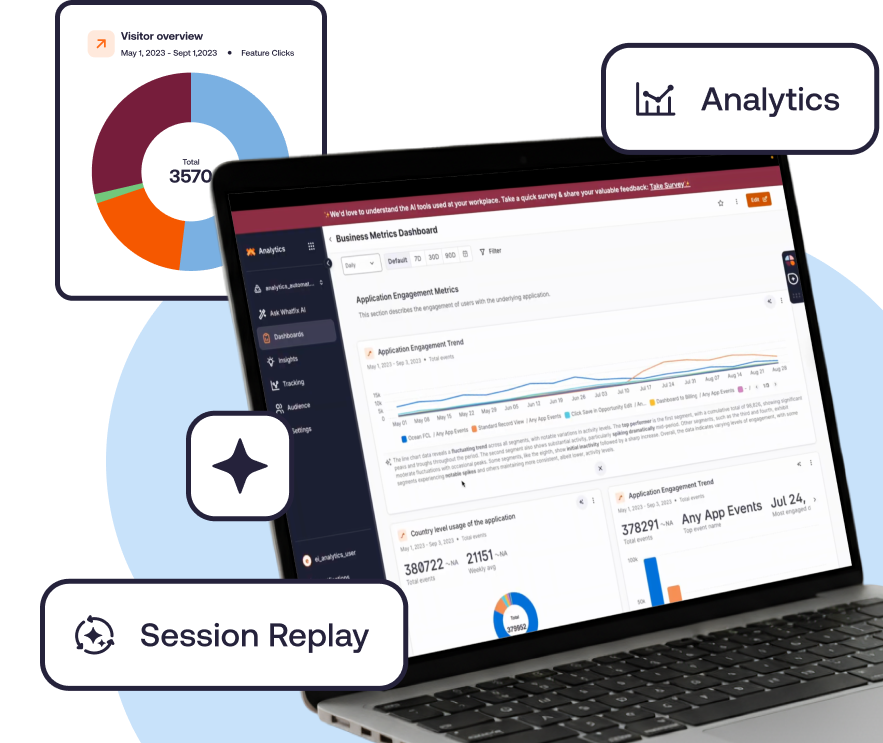
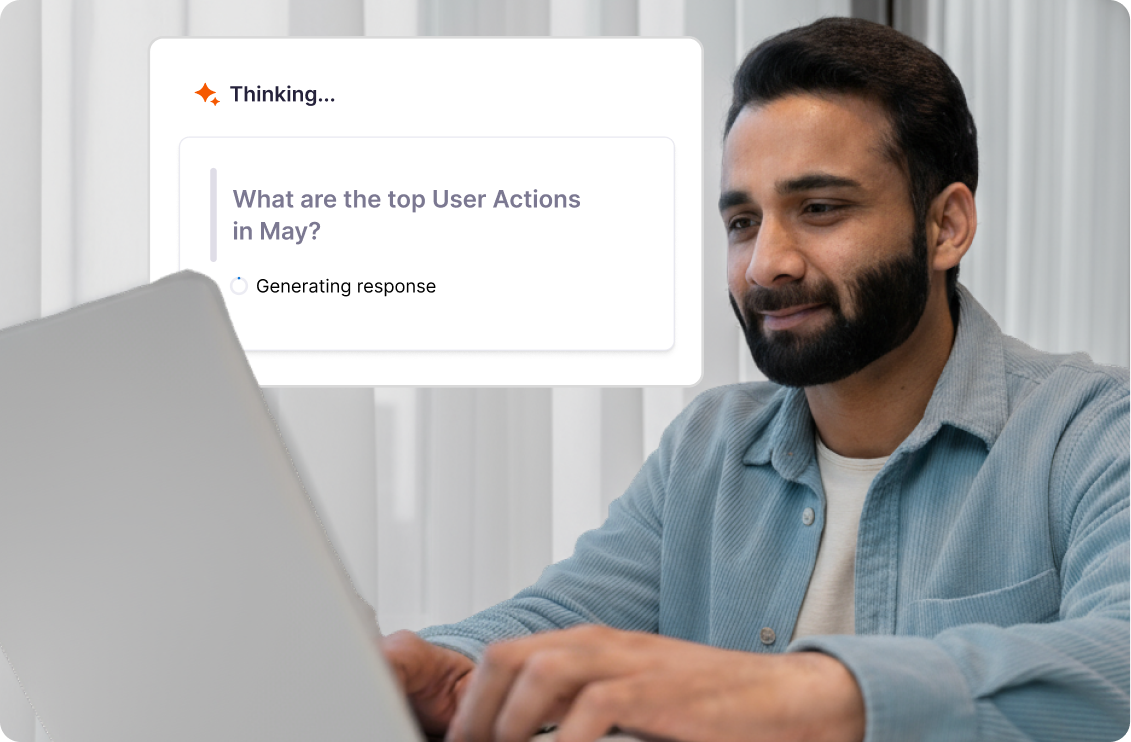
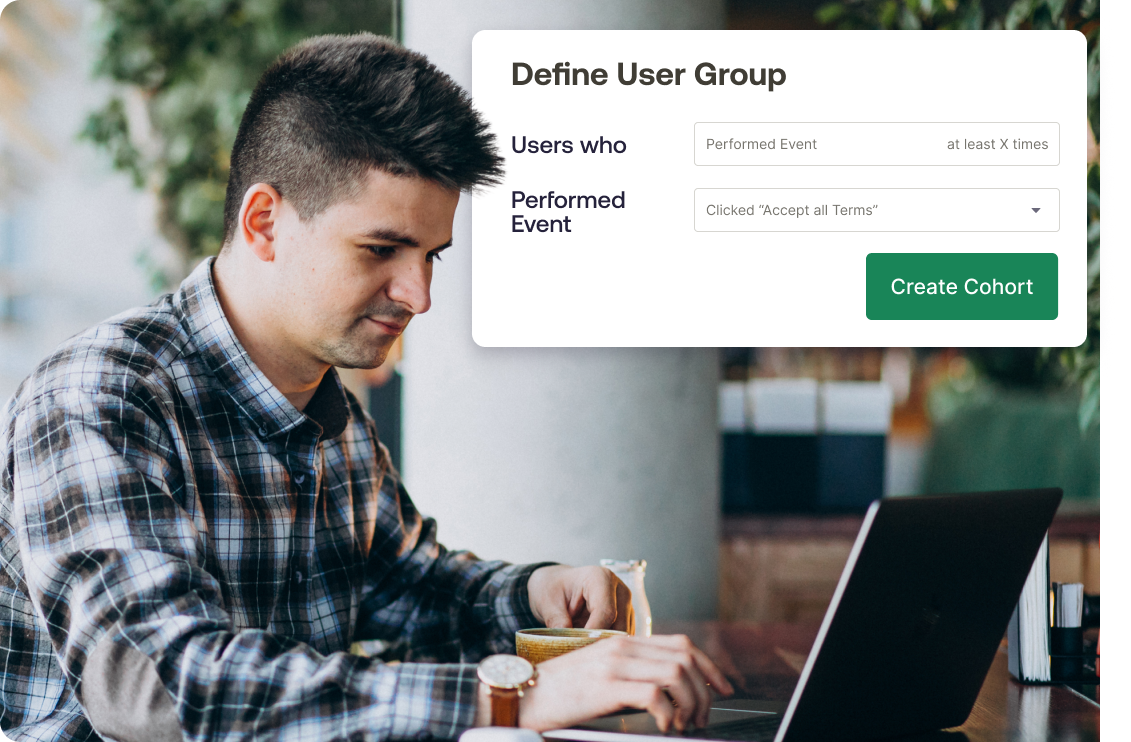
Whatfix Product Analytics provides visibility into how users interact with your software applications at a behavioral level. It captures clickstream data, feature usage, session paths, and engagement metrics across your tech stack to help product owners, IT teams, and business leaders understand adoption patterns, identify friction points, and measure ROI from application investments. It answers questions like Which workflows are underused? and Where do users drop off in key processes?
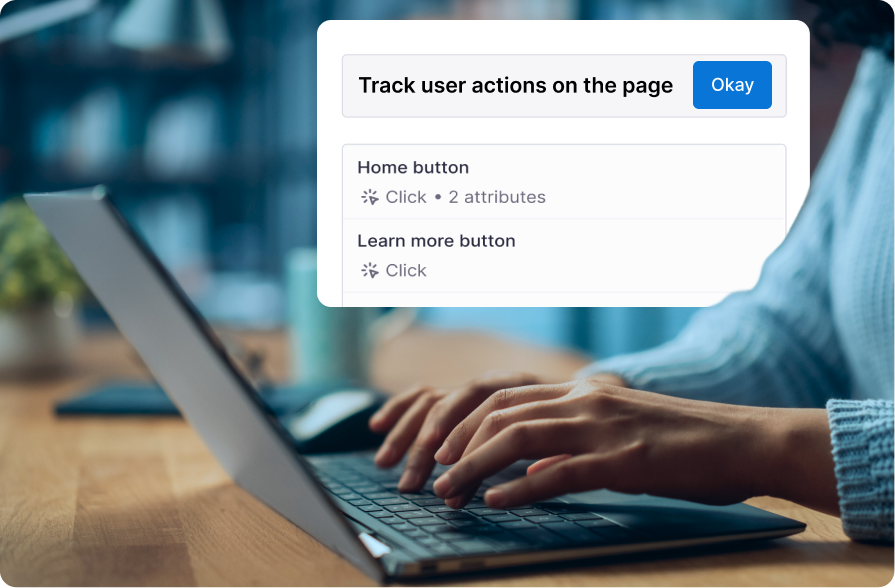
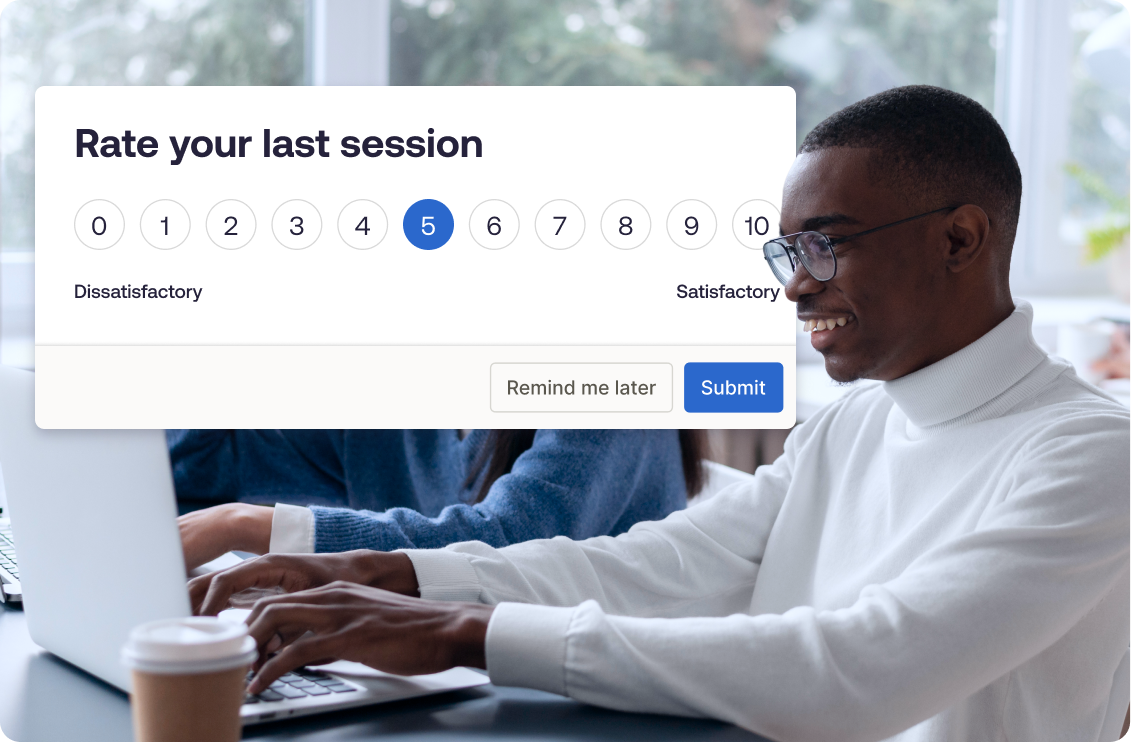
Whatfix DAP’s Guidance Analytics, on the other hand, focuses specifically on the performance of in-app experiences created through Whatfix—such as Flows, Smart Tips, Pop-Ups, and Task Lists. These analytics show how users engage with in-app guidance, completion rates for walkthroughs, search behavior in Self Help, and the overall effectiveness of your enablement content.
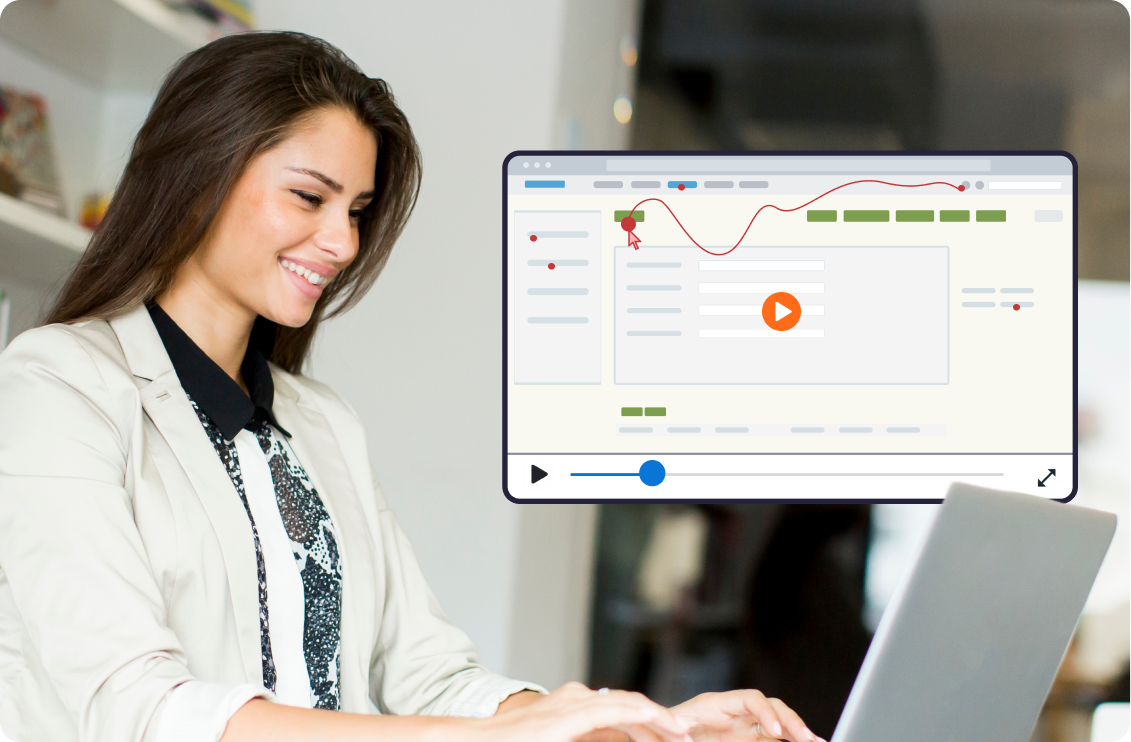
In short, Product Analytics tracks what users do in your application, while Guidance Analytics measures how effectively Whatfix content drives those user actions. Together, they deliver a complete view of user behavior and enablement impact across enterprise software.

")
")
")