


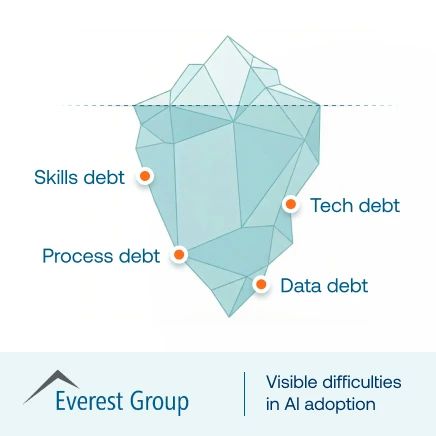


80% of features in the average software product are rarely or never used. That means most product teams are pouring resources into development that customers ignore. Product analytics is the only way to change that. It uncovers how users engage, highlights friction, and shows which features actually deliver value.
Without analytics, teams rely on gut instinct or anecdotal feedback. The result is wasted development effort, weak adoption, and missed growth opportunities. With analytics, you can validate priorities, accelerate adoption, and prove ROI with hard data.
In this article, you’ll learn:
- What product analytics is and how it differs from web or marketing analytics
- The essential metrics to track adoption, engagement, and retention
- Proven models like funnels and cohorts to decode user behavior
- How Whatfix equips product teams with embedded analytics and in-app guidance to turn insight into action
By the end, you’ll know how to transform raw usage data into decisions that improve adoption and drive business growth.
What Is Product Analytics?
Product analytics is the process of tracking, analyzing, and studying how users engage with a digital product or service. Product analytics tools enable product managers and IT teams to capture, visualize, and analyze product usage and user behavior data, such as user journeys, cohort analysis, funnel analysis, and more, to understand adoption, engagement, and overall experience. Product teams use these insights to make data-driven decisions to improve their products and services continuously.
Benefits of Product Analytics
Product analytics aims to help product teams understand how people use their digital products so that they can initiate and prioritize the right product iterations. Whether for a product manager or an engineer, product analytics provides a framework to help make data-driven decisions and is the first step towards building better, customer-centric products.
With product analytics, you can understand your customers’ usage patterns and the challenges that users face within the platform. Here’s an in-depth look at why that matters.
1. Create a more valuable product and an intuitive product experience
Product analytics empower teams to capture, monitor, visualize, analyze, and test user engagement and behavior with real-time data. This allows product teams to create optimal user experiences, identify dropoff or user friction points, map user flows, build user cohorts, track customer conversion events, measure feature adoption, and more.
With product analytics, you create an intuitive and valuable experience by monitoring usage patterns and engagement metrics to determine what your users want and need.
Here’s a simple checklist to leverage analytics in your product development:
- Which elements do your customers use most? Make them prominent, so they’re easy to find.
- What are the components users hardly ever interact with? Remove them or find the friction and fix it.
- Determine which features customers want but are not urgent. Put them on a backlog and slowly work towards them.
- Are there any features that customers often request? Understand the need behind the requests and find solutions.
2. Uncover areas of user friction and product pain points
Whether your product is new or seasoned, creating a valuable user experience should be at the top of your priorities. After all, only 1 out of 26 customers will ever reach out about a poor experience, and the rest (96.1%) will churn.
Eliminating friction minimizes churn. Some examples of product and user friction points that you can observe in product analytics include:
- High level of cart abandonment
- Rage clicks
- Finding documentation to support questions
- Clunky sign-up or check-out process
Customer service can help you understand your users’ stated problems, but product analytics will likely help you spot friction and prevent support tickets before they happen, reducing customer churn overall.
3. Make data-driven product roadmap decisions
A product roadmap is a visual representation of the features you want to build in a given period of time, with a timeline showing priorities and deadlines.
When customers request certain features or changes to your product, your development team creates a task and puts it somewhere on the roadmap, depending on its priority. How do you then figure out which priority to ship first?
Product analytics will help you assess how your customers use your product, their use cases, their interaction patterns, and the challenges they encounter so that you can judge which features will improve their user experience immediately and prioritize those in your roadmap.
Product teams are then empowered to make decisions based on product analytics data. Typically, a data-backed roadmap decision-making framework provides a path forward when your team may need clarification about what features to work on. Leverage a product roadmap tool to build your roadmaps and streamline this process.
4. Understand how users interact with your product
Product teams often have many questions about how their customers and users engage and interact with their products. A few examples of these questions include:
- What are my users’ friction points?
- What is the time-to-value for my users?
- What is my free-to-paid conversion rate?
- Who are my most valuable customers?
- What type of users are engaged, and what kind are churning?
- What new features are being adopted, and which need additional awareness marketing and end-user training?
- How long does it take my users to achieve their “aha!” moment?
Let’s look at an example: Your product’s conversion rate last month was 45% higher than the previous month. Of course, you want to figure out what changed so you can double down on it, right?
You can either:
- Take a guess
- Look at usage patterns to see why and how your customers are getting more value out of your product — using a product analytics platform
Product analytics allow you to observe usage patterns to see how users interact with your resources. Those patterns will help you learn how to enrich your products, reduce friction, simplify your UX, build features your customers will use, and increase your user adoption.
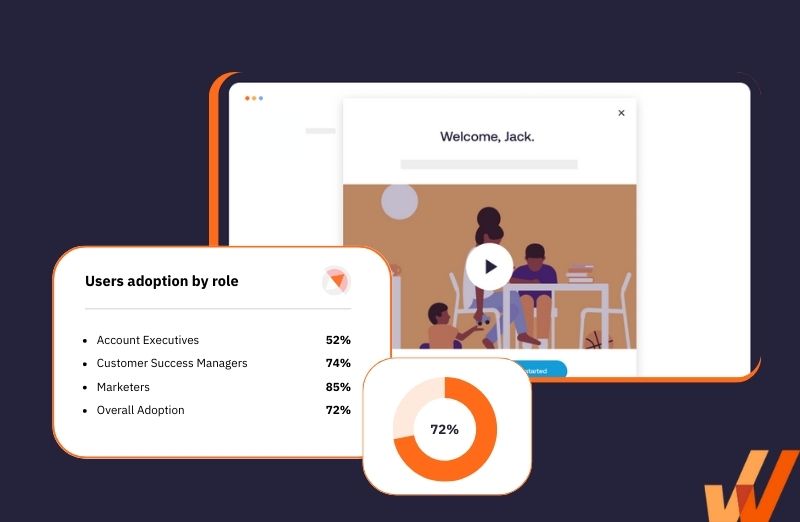
With a tool like Whatfix Analytics, product teams are empowered to track user journeys to analyze user flows, where users are experiencing pain points, and identify product areas to test and improve.

Key Metrics to Track with Product Analytics
Product managers across industries use product analytics to capture insights into their product’s experience and how users engage with it. Here are some of the key groups of metrics to track, along with some examples of each:
- Activation: activation rate, free trial conversion rate
- Engagement: session duration, number of sessions within a given period, bounce rate
- Retention: weekly retention, monthly retention, churn rate
- Customer LTV: LTV, subscription renewal rate,
- Adoption: adoption rate, feature adoption rate
Examples of Product Analytics Capabilities
Product analytics platforms shed light on all aspects of the user experience and the user journey, and as such, they’re incredibly dynamic. With a wide set of capabilities, they have become a must-have for all data-driven and user-centered product teams.
Here are some examples of what product analytics platforms usually provide:
- Behavioral Tracking
- Event Tracking
- Cohorts
- Segmentation
- Profiles
- Notifications
- A/B Testing
- Dashboards and reporting
- Heatmaps
- Session Recordings
- Funnels and Funnel Visualization
- Journey Tracking
- Journey Visualization
- User Friction
- Measurement Tools
8 Ways to Analyze Your Product Analytics
Although monitoring product analytics involves looking at many individual metrics, the art of product analytics also requires you to do in-depth analyses. In this section, we’ll go through the different types of analyses and how they can help you turn your product analytics into actionable insights.
1. Cohort analysis
Depending on various factors, there are likely different ways to segment your users within your entire user base. Here are a few examples:
- Demographics
- Company size
- Pricing plan
- Acquisition method
How exactly you define your segments or cohorts will depend on your platform and your target audience, but analyzing the behavior of each cohort separately is crucial for getting a nuanced perspective of your user base.
With a cohort analysis, you get a firm understanding of how each cohort interacts with your platform. You can personalize the experience when needed—for example, serving product guidance where a particular cohort seems to drop off while others don’t.

2. Churn analysis
Churn is when your customers leave and don’t return to the platform or don’t renew their subscription. Since new customers cost money to acquire and most companies want to expand their user base, retaining customers over time exponentially is usually a critical KPI for product teams.
Analyzing who churns, when they churn, and why they churn can help give you direction for product iterations that keep your users on the platform. When analyzing churn, you’ll want to use your product analytics to understand your overall churn rate for different types of users, and the corollary behavior that leads them to drop off the platform or subscription.
For example, if you see in your product analytics that you have a significant number of users who churn soon after their onboarding experience, your team might want to consider testing new versions of your onboarding flow to see if you can create a better experience that is more likely to retain new users
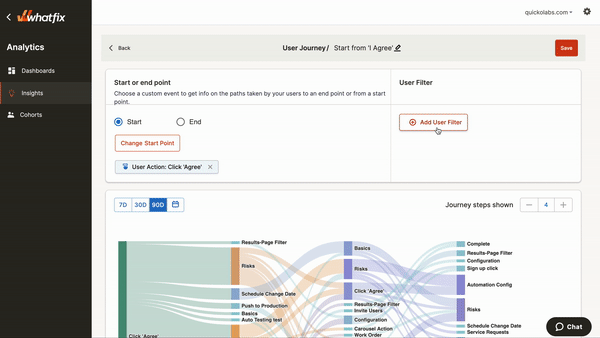
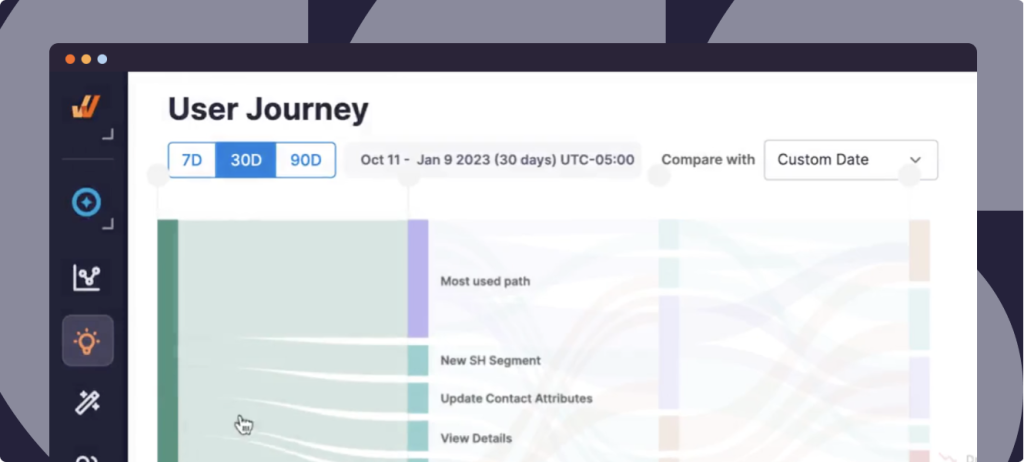
3. User path analysis
Sometimes called user journey analysis, user flow analysis means tracking and analyzing the actions and steps your users take as they interact with your platform.
Typically, your product analytics platform will offer a visualization of your users’ various paths. These visualizations are key for understanding where users might struggle in your platform, because you can easily see where users tend to drop off or behave erratically, indicating some sort of friction or confusion.
When you know at what point in each product flow your users struggle, you can offer help by making UX improvements or serving guidance at key points in each user flow.

4. Retention analysis
The opposite of churn is user retention, when users stay on the platform and ideally keep renewing their subscription.
As discussed, churn analysis is vital for understanding who leaves and why, so you can react to your insights and prevent them from happening in the future. So, too, is retention analysis: you want to understand everything you can about users who stick around so that you can try to mimic that experience for others and increase your overall retention rates.
For example, if you notice that users who use a particular feature on your platform tend to retain better, you can ideate product initiatives that drive more users to that particular feature, likely increasing retention overall.
5. Funnel analysis
Funnel analysis examines all of the steps required to achieve a particular outcome or point in the user journey. For example, a conversion funnel looks at everything that happens until a user pays for your platform.
The advantage of funnel analysis is that, through funnel visualizations, you can see where users typically drop off and then react to it.
If we keep with our example of a conversion funnel, you could notice in your funnel analysis that users tend to drop off when you ask them to create an account, right before they need to enter their credit card information. You might test a flow where users enter their credit card information before creating their account to see if that pushes more users through the conversion funnel successfully.

6. Conversion analysis
Conversion analysis explores everything related to when, how, and why users pay for your platform. All of the product analytics around conversion are important because, ultimately, the success of your conversion funnel informs your overall revenue.
As discussed in the previous section, looking at your overall conversion funnel is important – but that’s not all when it comes to your conversion analysis. Some other examples of what you might mine for insights when doing conversion analysis are:
- The feature usage that correlates positively with conversion
- The version of your onboarding that is most likely to end with conversion
- The acquisition source that brings users who are most likely to convert
Getting a 360-degree view of conversion will help your team iterate to the benefit of your revenue goals.
7. Milestone analytics
Throughout the customer journey, certain milestones are important for the product team to take note of and to optimize. Some examples of potential user milestones are:
- The “aha!” moment.
- Time-to-value.
- Advanced feature adoption rate.
Once your team defines the most critical milestones in the user journey, you’ll want to use your product analytics to analyze each milestone’s journey thoroughly.
Proper milestone analysis will likely help your team understand what user behavior seamlessly leads users to each milestone and what stands in their way. You can then create product iterations that decrease friction and move users speedily to each milestone.
8. User friction analysis
Anything that impedes your users from accomplishing their necessary tasks and overall having a good user experience is defined as friction. One of the primary functions of product analytics is figuring out where your customers struggle so that you can act on it. User friction analysis is the intentional hunt for anything interfering with a great user experience.
For example, observing where users tend to drop off in a particular flow indicates some type of friction. When you see a dropoff in your analytics, you and your team can propose iterations that improve that precise part of the user experience.
How Do Different Teams Use Product Analytics?
Product analytics helps engineers, marketers, developers, and designers gauge customer satisfaction, inspect campaigns in detail, optimize resources, and create offers tailored to users’ pain points. Let’s examine how different members of an organization utilize product analytics.
1. Product managers
A product manager defines what users want, connects those envisioned features to a company’s bigger goals (such as revenue, growth, etc.), and prioritizes these features according to impact. Product analytics are the key to doing all of this in a data-driven way.
Most PMs look at a wide variety of metrics, but here are a few examples and how they’re used:
- Feature Adoption Rate: This helps PMs understand how long it takes users to utilize key functionality within the product so they can optimize in order to make it faster and smoother
- Trial to Paid Conversion Rate: This allows PMs to analyze the journey until users decide to continue using the platform and pay when their trial ends. PMs can analyze the rate and related metrics to increase the likelihood that users convert after their trial.
2. Product marketers
Product marketers understand the target audience in-depth, using everything from market and user research to behavior analytics. They make data-driven decisions about marketing campaigns and typically own positioning and message. Here are some examples of product metrics often used by product marketers.
- Retention Rate: Looking at retention analytics helps product marketers understand whether their various marketing channels and campaigns are bringing users who are a good match for the value that the platform gives
- Daily and Monthly Active Users: Product marketers are generally very growth-focused, and these top-line metrics give a good sense of how the platform’s user base is growing over time, and when it’s time to adjust the marketing strategy to fuel further growth
3. Developers and engineers
An organization’s developers do some heavy lifting, turning ideas on a product roadmap into usable features for users. Product analytics help developers and engineers understand where there might be bugs or an opportunity for technical innovation. Here are some analytics that could be relevant to the tech team:
- Funnel Drop-Off: Funnel analysis can give the tech team a clue that there may be a technical problem; when users drop off in a funnel, there are a variety of explanations, but a technical issue is plausible, and engineers will want to double-check
- Cohort Analysis: Particularly when you look at user groups by device or browser type, it’s possible for engineers to sleuth technical issues that are device or browser-specific.
4. UX designers
UX designers use product analytics to understand user engagement in features and flows. These data points help designers understand where there are potential UX issues and what product iterations they may want to prioritize. Some metrics that are important for UX designers are:
- Onboarding Completion Rate: Since onboarding sets the tone for the user experience in general, designers will want to prioritize anything that seems to be hindering a user’s ability to complete their onboarding
- Task Success: The percentage of users who complete a specific task or flow within the platform gives UX designers valuable information about whether or not anything in the experience should be optimized
5. Business analysts
Business analysts are continuously evaluating how well a company meets its users’ needs, how that affects revenue, and scoping out new business opportunities. Business analysts work with a wide variety of data, including product analytics. Here are some examples:
- Customer LTV: The lifetime financial value of a customer is of particular importance to a business analyst, and they will likely take a look at the differences between cohorts to overall understand who the most valuable user type is – and suggest it as an area of focus
- Conversion Rate: Business analysts will be tracking the conversion rate and the various factors that influence it so that they cna make key recommendations that increase overall revenue and the value of a customer
6. Customer success
After sales and marketing acquire customers, customer success nurtures the relationship by understanding user pain points and providing solutions, both proactively and reactively. Customer success uses a wide variety of information to do this, such as talking directly to customers and – you guessed it – product analytics. Some product analytics that are relevant to customer success are:
- Churn Rate: Customer success managers will look at where churn rate is highest, try to understand the pain points that cause certain user groups to churn, and work with the product team to suggest iterations that keep users on the platform
- Subscription Renewal Rate: When customer success understands the overall health of renewals, it gives them direction for working cross-functionally to increase it – and increased renewals mean happier customers and increased revenue
7. Growth managers
What keeps a growth manager awake at night is this: how do we grow our user base exponentially? Product analytics are a big part of the data-driven decisions that growth managers need to make to do so. Here are some examples of relevant metrics for growth managers:
- Activation Rate: After sales and marketing bring customers, growth managers want to understand the rate at which those users are activated – meaning use key features or pay, for example – so that they can lead initiatives to increase that rate and ultimately grow a platform’s active user base
- Site Bounce Rate: When users make it to a platform’s website and leave, it means that a company has missed an opportunity to grow its user base; for that reason, growth managers are always looking at the bounce rate and trying to decrease it and get more users onto the platform
Best Practices for a Product Analytics Strategy
It’s not enough to simply sign up for a product analytics tool, hook it up with your product, check out a few reports now and then, and send them to the rest of your team. Your team needs a strategy to integrate product analytics into your product development.
Here are a few steps to get started with product analytics:
1. Choose the right product analytics platform
The success of your product analytics strategy hinges on the tools you use, how seamlessly they sync with the rest of your product management stack, and how well they help you make data-driven decisions quickly. In short, choosing the right product analytics software is far from trivial.
An ideal product analytics tool should be flexible enough to use on small projects where you’re tracking dozens of daily interactions and scalable enough to grow with your product as you add new features, flow, and overall complexity.
PRO TIP
With no-code product analytics software like Whatfix Product Analytics, you can empower product managers, IT teams, and anyone who requires insights into product usage and digital adoption by tracking end-user engagement, identifying trends and friction points, mapping user flows and journeys, creating user cohorts, monitoring end-user analytics, and more. Whatfix AI enables product managers to auto-analyze user behavior and generate automated reports.

2. Create a cross-functional team of product analytics collaborators
Product analytics is a team sport. Everyone involved in the product management & promotion process needs a seat at the table so they can:
- Observe how users engage with your product,
- Figure out a strategy to get closer to your key KPIs and give more value to the user, and
- Coordinate their efforts with the rest of the team to tackle your product development cohesively.
All of this involves a cross-functional team of product managers, developers, engineers, marketers, designers, and leadership. A great product analytics platform will create a transparent, simple way for everyone on the team to speak the same language when it comes to the data needed to make key product and business decisions.
3. Define core metrics and plan product analytics implementation
Make a shortlist of the metrics you intend to monitor and create an action plan on how you’ll leverage them in your product development decisions. This can be as temporary as deciding which metrics will determine the final result of an A/B test or as long-term as deciding what metrics you want to improve overall in the coming year.
Examples of product adoption metrics include:
- Active users
- Retention rate
- User activation rate
- Engagement
- Churn rate
- Usage frequency
- Feature adoption
If your company is earlier on in its journey, you can focus on just a few core metrics, benchmark your product’s performance, optimize your product to improve them, and avoid overwhelming your team with dashboards and reports.
4. Use your product analytics stack to make data-informed decisions
Having product analytics is only one part of the product optimization process. That is, it doesn’t make much of a difference if you only collect and display lots of metrics on nice-looking dashboards and reports.
Make product analytics a core part of your product development process. Use historical data to predict performance, and keep optimizing your user experience based on what you observe in the data so that you can maintain a product that customers want to pay for.
5. Prioritize data management
Keep data clean, document taxonomies, fix issues, realize everything won’t be perfect, make data accessible, break down data silos
As your user base and feature set grow, your data infrastructure becomes more and more complex. In order to keep things running smoothly, it’s important to manage your data well right from the start. Here are a few ways to do just that:
- Keep your data clean: Use clear naming conventions, refer to each property or event only once, and don’t add tracking that you don’t need.
- Document your data taxonomy: It’s not enough to have naming conventions and processes for organizing data—you have to make sure that they’re documented and accessible so that everyone at your organization follows those guidelines and it doesn’t become unwieldy.
- Make data accessible: Use a product analytics platform so that your data does more for the organization than sit in a backend database where only people who can code can access it.
- Break down data silos: If you notice that different teams are operating with certain data sets and not others, stop them and centralize everything to ensure that everyone is looking at the same metrics, defined in the same way, for the sake of cross-functional alignment.
- Accept that it won’t be perfect: Even with the best of intentions, you’re likely to make some mistakes– and that’s okay. Some teams have rituals, like a yearly data cleanup hackathon, to help detect and fix issues.
6. Maintain data governance
Data governance is what you do to keep your data sets:
- Accurate
- Secure and private
- Usable
All the best practices we’ve mentioned will help you do just that. Still, it’s essential to have someone at your organization who owns data governance and can bring security, accuracy, and accessibility issues to everyone’s attention.
7. Integrate other data sources
Your initial implementation of a product analytics platform will utilize data from your own platform’s backend, like events and user properties. However, as you move forward in your journey as a data-driven company, you’ll likely want to add other sources of data to deepen your analyses. Here are some examples of other relevant data sources:
- CRM like Salesforce.
- Help desk like Zendesk.
- Advertising platforms.
- Google Analytics and general web traffic.
- Chat interfaces like Intercom or Drift.
- Marketing automation like Pardot or HubSpot.
By integrating other data sources, you can understand each user group’s journey with much more nuance, from acquisition onward.
Product Analytics vs. Other Data Solutions
Product teams have a wide variety of data sources available to them. Let’s take a quick look at how product analytics compare.
- Business intelligence tools: These tools provide nuanced data points but generally require a lot of effort to learn the platform. Most companies benefit from having someone utilize a business intelligence tool, but product teams will find that product analytics are more accessible and offer insights that are easier to translate to action.
- Data management platforms: These platforms collect data, manage it, and store it so that the entire company can have access to large amounts of data as needed. However, they don’t analyze the data or offer granular user insights like product analytics, and often require the ability to code in order to get value. Many companies have data teams that manage platforms like these, and they’re usually not members of the product team.
- Web analytics (like Google Analytics): Web analytics provide many different data points about what happens when users are on your website, such as page visits, CTA clicks, and SEO oriented metrics. However, these are more illuminating when it comes to your marketing goals, whereas product analytics tell you about how your users interact with your actual platform once they’ve begun to use the product.
Why Invest in Product Analytics?
There is absolutely never a reason not to invest in product analytics. Your analytics are the key to making reliable, data-driven product decisions that help your company reach all of its key KPIs and ensure that your users are getting premium value from your platform.
Let’s take a look at how product analytics can be utilized to your advantage at different stages of a company’s lifecycle:
- Small companies: Product analytics are essential for starting off on the right foot and ramping up for growth. For example, small companies will learn which features provide the most value with metrics like feature adoption, whether or not their onboarding needs some work to fuel growth with the onboarding completion rate, and spot UX issues by looking for signs of friction in their funnel analysis.
- Growth and mid-sized companies: At this stage, you have a sizable user base, and product analytics help you get even more nuanced when it comes to understanding your user base and how to give them more value. For example, companies in the growth stage will want to use cohort analysis to understand who the top-value user groups are to double down on, funnel analysis to spot UX issues with their newer, more complex feature sets, and track conversion rate and related metrics to optimize for more revenue and fuel growth.
- Large enterprise companies: Large companies generally have large teams and ambitious goals; product analytics ensures that every function and team is operating in a data-driven way. For example, tracking all conversion-oriented metrics makes sure that everyone at the organization is aware of where they stand in terms of revenue goals, funnel analysis points teams in the right direction as to where there may be a leaky bucket stunting growth. Retention metrics are of particular importance in terms of understanding whether your company is giving enough value for users to stick around.
Software Clicks Better With Whatfix Product Analytics
Choosing a product analytics platform is a balancing act. On one hand, you need a powerful platform to show how users navigate and interact with your product. On the other hand, all that functionality needs to be efficient so as not to degrade your application’s performance.
Your product analytics platform should be simple enough to serve as a source of truth for your product, UX, and marketing teams, both technical and non-technical alike.
Whatfix empowers you to understand how users interact with your product, the issues they’re facing, the features you should (and should not) build to unlock product-led growth, and no-code content creation tools to fix and test these experiences.
Whatfix provides the best product analytics, digital experience, and adoption tools all in one powerful product adoption and experience platform.
Get started by exploring how Whatfix Analytics empowers product teams now!