Customer Experience Analytics: How to Take Action
- Published:
- Updated: July 2, 2024

Whether you’re a UX research professional or a product manager, you’re undoubtedly thinking a lot about giving value to your users with product iterations. You want your product strategy to create a more useful and intuitive experience for your sought-after customers.
The challenge is that defining an optimal experience depends on your ability to understand the user journey, identify friction points, and track the adoption of features and processes within your platform.
By tracking and analyzing your customer experience and user behavior analytics, you capture valuable CX-related analytics that can help you take a data-driven approach to improving your CX.
In this article, we’ll discuss the concept of CX analytics, explore the most commonly tracked customer experience analytics, and discuss how you can take action based on CX-related data.
What Is Customer Experience Analytics?
Customer experience analytics (otherwise known as CX analytics) refers to the collection and analysis of data points that help you and your team understand how users engage with your product. The ultimate goal is to use that knowledge to optimize the user experience.
Benefits of monitoring and analyzing customer experience data include:
- Better mapping and understanding the customer journey: Most products and platforms have multiple features and workflows. Data collection, visualization, and analysis help you understand what your customers do, in what order, and with what frequency.
- Building better products that meet customer needs: The right data will tell you what features and flows give your customers value so that you can build your product strategy around what benefits your customers the most.
- Identify areas of friction, understand their impact, and turn them into areas of product growth: What’s intuitive to your product team isn’t always intuitive to your users, and CX data can help you understand exactly where your customers struggle so that their pain points ultimately become your next successful product iterations.
- Identifying emerging customer trends throughout the customer lifecycle: No target market is stagnant, and the right analytics will help you monitor trends in customer behavior to stay ahead of the game by responding to ever-evolving customer needs.
- Taking a data-driven approach to optimizing your entire customer experience: A customer experience metric puts an end to endless debates on your team about what your customers do and need by allowing you to use a quantitative approach to customer understanding.
Direct vs Indirect Customer Experience Analytics
Broadly, there are two types of CX analytics: direct and indirect. Both direct and indirect customer experience analytics are crucial for understanding and optimizing the customer experience.
- Direct CX analytics are user feedback metrics that you track regularly to gain insight into your customers’ perceptions of your platform’s overall experience and/or their experience with specific features and flows. These data points are important for keeping tabs on how your customers perceive the value you’re providing and which product iterations are connected to higher satisfaction.
- Indirect CX analytics are user behavior metrics that enable you to understand the relationship between customer engagement on your platform and your team’s KPIs. Overall, indirect metrics give insights into the health of the customer experience and the connection between the experience and your business KPIs.
Related Resources
14 Important CX Metrics to Track
While every company will have contextual CX metrics they monitor, here are fourteen of the most commonly tracked customer experience KPIs to help teams analyze, benchmark, and optimize their customer-facing experiences.
Direct customer experience analytics
- Net Promoter Score (NPS): With NPS, customers are asked how likely they are to recommend your platform to a friend or colleague, generally on a scale from 1-10. The underlying assumption of NPS is that we’re only likely to give our personal recommendation when we’re receiving significant value from something, and so this serves as one great data point for looking at how well you’re serving your target audience.
- Customer Satisfaction (CSAT): Monitoring your CSAT involves directly asking your customers to rate their satisfaction with the platform. This is yet another metric that can help you understand how your customers perceive the value of your product. Another great thing about CSAT is that while you can look at user perception of the platform overall, you can also use it to measure satisfaction with specific features and flows (particularly useful when you’ve released something new!).
- Customer effort score (CES): The CES is generally measured by asking your customers to rate how easy or difficult a task was, usually on a 7-point scale. Like the CSAT, the CES can measure the overall experience and/or the ease of use for a specific feature or flow.
- Voice of the customer (VOC): The VOC metric is a quantitative representation about how your customers view the value of your platform and its ease of use. It generally combines NPS, CSAT, and CES to give an overall picture of how your customers are feeling about what you’re offering.
- Open text feedback and qualitative data: In a sea of numbers, it’s easy to forget that the why behind the above metrics can give you and your team a lot of important insight. Collecting qualitative data, often via open text on your platform, can help you understand why your customers are/aren’t getting value or having an easy time utilizing your features and flows. This type of data can give impactful direction in terms of focus areas for product iterations.
Indirect customer experience analytics
- Average handle time (AHT): AHT tells you, on average, how long it takes your customers to perform a certain action or series of actions on your platform. It’s useful for understanding the impact of your product iterations on ease of use.
- Customer lifetime value: Customer lifetime value measures the expected profit from each customer throughout their stay on your platform. This is one of the key metrics that helps you connect the customer experience and your business KPIs. If your customer lifetime value consistently goes up, your product and monetization strategy is likely in harmony – and that’s a good thing.
- Time-to-resolution for support issues: Customers struggle with something on your platform when they reach out for support. For customer satisfaction and retention, your team should try and solve these issues as quickly as possible. The time-to-resolution metric measures exactly how fast your support team gets it done.
- Time-to-value (TTV): TTV measures the time it takes your customers from onboarding to your platform until they derive some sort of benefit from the product. Depending on your product, you can measure time to value in different ways: for example, how long it takes users to upgrade from a free to paid version, or how long it takes to do a specific action that you regard as a value indicator. The lower the time to value, the more likely you’ll reap the benefits of customer retention and satisfaction.
- Advanced feature adoption: Once your customers have been onboarded and are consistently using the primary features on your platform, you may have more advanced features and flows that give an extra layer of value to your customers and can positively influence customer retention when utilized. Advanced feature adoption measures the time it takes a user to adopt an advanced feature, the length of time they utilize it, the extent to which they utilize it, and the depth with which they utilize it. Quick and quality advanced feature adoption supports customer retention and satisfaction goals.
- Average spend: The average spend tells you the average amount of money a customer spends, and in all likelihood, your goal is to understand which product iterations contribute to an increase in this number so that you can support your business KPIs.
- Customer churn rate: Customer churn metrics measure the frequency you lose customers during a given period. So, your monthly churn rate will tell you what percentage of customers you lose monthly. Lowering this metric over time indicates a product strategy that supports customer satisfaction and perceived value.
- Customer renewal rate: The customer renewal rate is a metric that tells you the percentage of customers who renew their membership to your platform. So if your platform offers a yearly subscription, your renewal rate will tell you what portion of your user base renews for the following year. Increasing this metric is also a great indicator of customer value and satisfaction.
- Communication metadata: Metadata is data that gives context to other metrics. Communication metadata can help you understand the above metrics in the context of user attributes. For example, you can look at what device a user is using while accessing your platform, or the acquisition source of a particular group of users. Often, customer satisfaction and platform engagement aren’t uniform; some subsets of users may be more satisfied than others, and these nuanced metrics give you some direction regarding who needs what.
How to Take Action With Customer Experience Analytics
Ultimately, the usefulness of data only begins with tracking the right metrics; the real magic starts to happen when you utilize your customer experience analytics to take action that influences customer satisfaction, reduces user friction, and enables you to achieve your business goals.
Let’s look at some of the most impactful ways to do that.
1. Improve onboarding completion rates and reduce time-to-value
Everyone knows that first impressions count and onboarding is the digital version of a first date. Here, your customers begin to form their impressions about your value propositions and relevance.
While collecting information about your new user during onboarding is important, the path to success is more dependent on engaging customers and ensuring that they get some sort of value quickly. Users interested in and benefit quickly from the platform are much more likely to be retained as customers.
Your time-to-value metric is a key indicator of how effective your onboarding is at setting your new customers up for success. We recommend testing several versions of your user onboarding flow and measuring time-to-value for each variant—and over time, redoing this test whenever your team feels compelled to revamp it.
2. Drive advanced and new feature adoption
Once you’ve onboarded a customer, likely, they’ve already started engaging with your primary features and get some value from doing so. In all likelihood, though, you’ve got even more advanced features that can enhance the user experience somewhere under the hood – and if you don’t yet, you’re sure to release some in the future.
Since customers are people and people tend to be habitual, you’ll probably have to guide your users by creating awareness and giving instructions about advanced or new features. A great way to measure the effectiveness of these initiatives is to utilize advanced feature adoption metrics.
For example, we recommend looking at how long, on average, it takes users to adopt new and advanced features. Your team should brainstorm various initiatives related to these features to shorten the amount it takes in a user’s journey to adopt and benefit from them.
Another tip: Besides monitoring feature adoption metrics, you should utilize CSAT and CES to understand how users perceive your new and advanced features. This will give you additional insights for future data-based and customer-centric iterations.
3. Reduce churn by identifying areas of user friction
Customers can churn for many reasons, chief among them is experiencing friction when trying to accomplish a task on your platform. Fortunately, a variety of customer experience metrics can help you understand when and where your users are struggling so that you can start problem-solving.
Customer Effort Score (CES) is a great metric. After users complete a task, ask them how simple or difficult it was, and always seek to improve this number. You can also ask users to give a CES score if they drop while completing a flow to learn more about whether the user experience was why they abandoned the task.
Product analytics provide you with insights into where user friction is occurring. For example, for a specific workflow, you can use your analytics to look at a specific funnel: where do users drop off? Where do they spend more time than you had anticipated? This analysis will tell you more about which features and flow steps need to be improved.
4. Deflect customer support tickets
While support teams are crucial tools for most teams, support tickets should be seen as a last resort for solving user problems with your platform.
Why? From the user’s perspective, it’s a time-waster; they have to wait for a reply before completing what they want. From the company perspective, more support tickets mean more resources spent answering users and an indication that your user experience isn’t ideal.
The good news is that you can utilize your customer experience analytics to create a strategy to reduce the number of users who defer to the support team for help.
Your CES is a great metric to track for this purpose; the lower the effort score, the less likely your users are to contact support. Ensure that the CES stays low or gets lower with each product initiative. The way to keep your CES in an ideal range is to create intuitive flows and give your users in-app guidance precisely where they need it—we’ll talk more about that soon.
5. Increase account expansions and upselling
Why are we obsessed with increasing value to the customer? Aside from goodwill, we know that the more our users benefit from our platform, the more likely our product strategy will fuel our business goals. Overall, the most important business goals relate to revenue.
With CX analytics such as customer lifetime value, average spend, customer renewal rate, and customer churn rate, we can monitor which of our product initiatives support an increase in our bottom line.
Often, your team will need to do more than simply release new features to get customers to spend more money. The product team will need to take measures to ensure that users are aware of, and know how to use, whatever expanded value propositions you’re offering. In the next section, we’ll discuss strategies for doing just that.
6. Personalizing customer experiences
Once you start monitoring your analytics more closely, you’ll soon see that customers behave differently and have different experiences on your platform. It’s challenging, and sometimes impossible, to create a one-size-fits-all product strategy. Fortunately, your CX analytics allow you to personalize a user’s experience based on your customers’ needs.
Personalization involves segmenting your users and looking at your relevant CX and product analytics across various segments. One great way to do this is to use your communication metadata to understand how different users behave: does the type of device they use to influence their CSAT or CES or make friction in a specific flow more likely? Are users with different demographic attributes more or less likely to adopt a new or advanced feature?
As you begin to answer these questions, your team can then strategize for how to personalize the experience in an ideal way for different user groups, likely to the benefit of your business KPIs.
RECOMMENDED Article

Create customer experiences that click better with Whatfix
By now, you’re probably itching to get started – who wouldn’t want nuanced, actionable information about their user base for an effective product strategy?
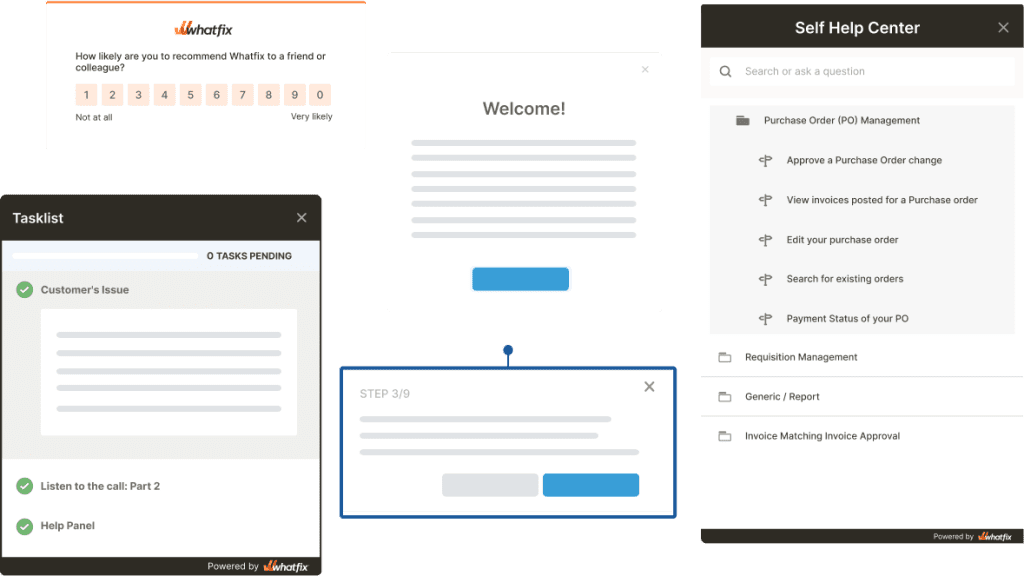
Whatfix enables CX teams and product managers with two AI-powered platforms to collect and analyze customer behavior and product usage, and take action to enable customers with contextual in-app guidance and support.
Whatfix’s digital adoption platform (DAP) provides organizations a no-code tool to create in-app guided experiences like Tours, Task Lists, Flows, and more. Provide end-users with on-demand access to support with Self Help, providing users with an in-app resource center. Create product-led onboarding experiences with contextual Tours and Task Lists, drive new feature adoption with Pop-Ups, and collect user feedback with in-app Surveys.
The Whatfix Product Analytics platform enables organizations with a no-code custom event tracking tool. With Whatfix Product Analytics, users can understand the user journey in depth, analyze user funnels, identify where friction is occurring, and pinpoint struggling user segments.
Together, use these two tools to take a flywheel approach to continuous customer experience improvement, backed by data.
Here are four examples of how you can improve your customer experience with Whatfix:
1. Create guided onboarding experiences that reduce time-to-value and engage new users
Whatfix is a digital adoption platform (DAP) that allows you to create and test contextual user onboarding experiences. This will help you get your customers from their initial usage to value faster and get them excited about what’s ahead.
You can use the DAP to create immersive, conversational experiences with your customers using elements like product tours, interactive walkthroughs, user onboarding checklists, pop-ups, tooltips, and surveys.
Track how users engage and interact with your in-app guided onboarding and use analytics to identify areas for improvement. Benchmark the time it takes new customers to become daily-active users or realize value and run experiments to improve that journey.
2. Announce new features and drive account expansion with product-led growth experiences
Your customers can’t deepen their usage of your platform or increase their spending if they aren’t yet aware of the opportunities to do just that. With the Whatfix DAP, you can alert users at exactly the right time in a specific flow when a new or advanced feature might be helpful.
Good messaging and perfect timing will enable you to catch your users with additional value when and how they need it most, and you’ll see the benefits in CX metrics like customer renewal rate, average spend, time-to-value, and more.
Using product-led experiences, drive account expansion and upsell opportunities inside your application with in-app pop-ups, promotions, and alerts. Showcase how these new features or add-ons create additional value for your customers.
3. Drive advanced feature adoption and build power users with in-app tutorials
Advanced and new features will probably have a learning curve for unfamiliar users, and shortening that learning curve will lead to faster adoption and therefore, better business results.
With the Whatfix DAP, you can seamlessly create in-app tutorials that show your users how to use a new or advanced feature at key moments. Rather than relying on boring support articles, you can move your customers through the flow from discovery to adoption and see the fruits of your efforts in metrics like time-to-value and average spending.
4. Analyze customer engagement and user behavior with Whatfix Product Analytics
The more nuanced your understanding of what your users do, how, and when – the more likely you are to build a product strategy that supports your business goals and overall customer satisfaction.
Whatfix Product Analytics allows you to visualize user funnels, identify user friction points, and track all of the CX analytics we discussed today to inform your product strategy in actionable ways.
Which features support higher customer satisfaction? Where in a workflow are users struggling and dropping off? Which new product initiatives support a higher average customer spend? Answer these questions and plenty more with Whatfix Product Analytics.
Using Whatfix Product Analytics will help you understand your customers on a level you simply haven’t before, and it will help you get closer and closer to meeting your most important business goals.
Ready to get started? Request a Whatfix demo today!
Dive deeper with more customer growth & retention content.
Are you looking to become a more data-driven product manager? Explore our product analytic-centric content now.

What Is Whatfix?
Whatfix is a digital adoption platform that provides organizations with a no-code editor to create in-app guidance on any application that looks 100% native. With Whatfix, create interactive walkthroughs, product tours, task lists, smart tips, field validation, self-help wikis, hotspots, and more. Understand how users are engaging with your applications with advanced product analytics.
Like this article? Share it with your network.
Subscribe to the Whatfix newsletter now!
Table of Contents

Software Clicks With Whatfix
Whatfix's digital adoption platform empowers your employees, customers, and end-users with in-app guidance, reinforcement learning, and contextual self-help support to find maximum value from software.


Thank you for subscribing!
Sign up for the Digital Adoption Insider by Whatfix
Join 400,000+ monthly readers and receive best practices, expert insights, and insider tips for driving technology adoption and enabling end-users.