Levi Olmstead


Whether you’re a startup founder building an MVP or a product manager at a venture-scale company, there’s a significant correlation between user engagement and every other positive product health metric—APRU, profitability, recurring revenue, retention, customer satisfaction, conversions, etc.
Engaged users are more likely to understand how your product solves their challenges, share your product with their network, upgrade to paid (or pricier) tiers, and become dedicated product evangelists who stick around.
The most successful products have built their business model on cultivating user attention and getting them to see the platform as an indispensable extension of their personal or professional life.
This article will explore the concept of user engagement and explain how to build sticky products that drive engagement.
User engagement measures how users interact with a product, derive value from it, and see it as essential to their contextual needs. Consequently, higher engagement metrics generally indicate that users find your product helpful, which leads to increased user retention, satisfaction, and revenues.
User and customer engagement are similar concepts, but they primarily differ based on the subset of users involved, their conversion potential, the stage in the conversion funnel, etc. Here are the main differences between user and customer engagement:
Understanding how your users engage with your product is the first step in building a loyal, engaged customer base. With the right metrics and KPIs, you can make better decisions that lead to happier, more active users, ultimately creating better product experiences that drive higher product adoption rates.
Because user engagement is such a broad term, product teams can measure it across many metrics – many contextual to your product, industry, or business goals. However, here are core user engagement metrics to track, benchmark, analyze, and improve on:
Your daily active users (DAU), weekly active users (WAU), and monthly active users (MAU) are one of the most common user engagement metrics because it tells you the specific number of people who engage with your product over that specific period. It’s a great way to see how frequently your users take action on your app or product.
What counts as an “active” user will look different from platform to platform. You may count an active user as someone who logs into their account, or you may want to get more specific and only count users as active if they perform a specific action or task.
You can use DAU, WAU, or MAU to measure the effectiveness of marketing tactics, customer retention, and growth. When tracking DAU, WAU, and MAU, it’s also essential to note the events or campaigns that may have impacted spikes (or dips) in activity.
Number of logins (or repeat logins) is a relatively basic metric, but it’s still a good indicator of whether or not a user is still engaging with your product. Measuring the number of logins can give you a quick glimpse into whether your customer base is growing or if you’re just acquiring users who stop engaging after creating accounts.
Comparing the number of logins to other metrics, such as active users, can help you identify how many users may be accessing their accounts but not performing the bare minimum tasks. For example, you may find users are logging in, but they’re not completing your required “active” task. This may indicate a disconnect or issue that you need to resolve, or you may need to reevaluate if your “active” metric is a poor measurement.
Onboarding completion rate is the percentage of customers that finish your user onboarding flow.
Knowing your onboarding completion rate can help you identify areas of improvement when educating new users on how to get the most out of your product. Tracking where they fall out of the process can help you find gaps or overly complex areas that could be refined.
Onboarding completion rate could also give you insight into whether you’re converting the right leads. If your onboarding rate is particularly low, you might find that your new users don’t fit your target audience. Refining your sales process to onboard fewer but more aligned users can lead to better long-term retention.
PRO TIP
With a digital adoption platform like Whatfix DAP, product teams can create product-led onboarding experiences with product tours, interactive walkthroughs, and new user onboarding checklist. Use a simple no-code editor to create on-brand in-app guidance. Track and analyze how users engage with your onboarding flows, measure onboarding completion rate, and identify areas of friction.

Your product adoption rate is the percentage of new users who reach the full value of your product. To find your product adoption rate, you must determine when a user has reached full product value. This might be completing your onboarding process, using a certain feature, or a consistent login rate.
Similarly to the onboarding completion rate, your product adoption rate can tell you how many of your new users are engaging with your product.
You can find your product adoption rate by taking the number of active users, dividing it by the total number of user sign-ups, and multiplying by 100. Here is the formula: Product adoption rate = (New active users / sign-ups) x 100
Feature adoption rate is similar to product adoption rate but looks at specific features within your product or platform. The equation for measuring feature adoption is: Feature adoption rate = (Active feature users / total users) x 100
Feature adoption rate lets you identify your most popular tools, as well as those that might need extra support, better onboarding attention, or a more robust new feature announcement strategy. If you discover that some of your features aren’t popular among your users, you can make adjustments to meet their needs better or consider eliminating those particular features.
Time-to-first action measures the time between when a new user signs up for your product and when they perform a certain task or activity. Measuring time-to-first action lets you see how quickly new users engage with your product and specific product features.
Use this metric to improve your onboarding experience. You want time-to-first action to be as short as possible, so identify areas where users may lag and refine onboarding and customer education materials to help them find value in your features faster.
Average session duration measures the average time a user spends engaging with your app. Depending on the nature of your platform, session duration may be a more critical metric than logins or the number of actions performed.
Average session duration can give you a better understanding of how well your tool is meeting customer needs. If they’re quickly logging in and back out, there may be missed opportunities.
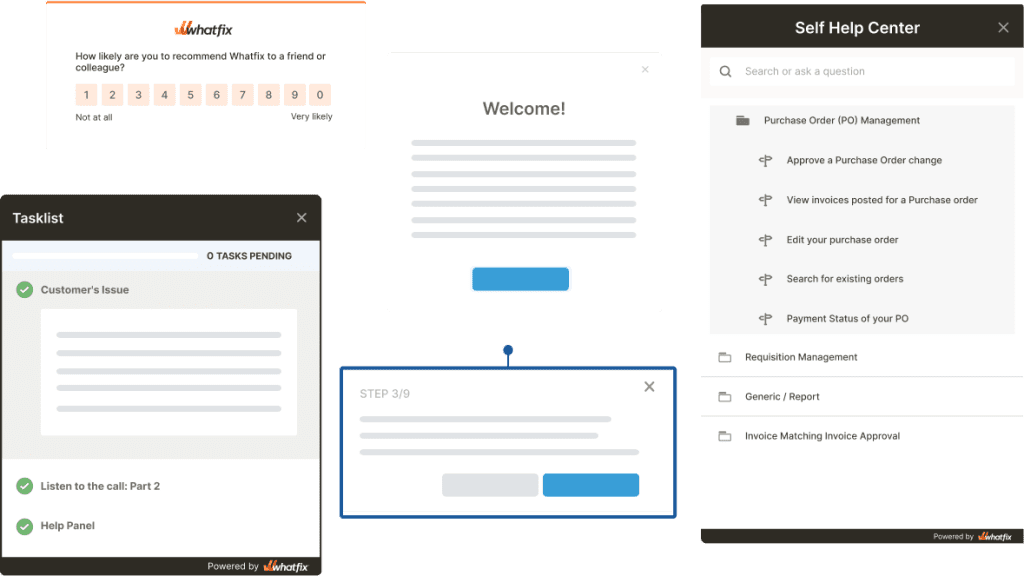
NPS measures customer loyalty and satisfaction. To find your NPS, survey your users, asking where on a scale of 0 to 10 they’d rank the likelihood they’d recommend your brand to a friend or colleague.
Although NPS requires a bit more effort to collect than just tracking analytics, it can be a great way to get direct product feedback from your users. It gives you a quick picture of how well you connect with your users and if you’re on the right track to building a loyal customer base.
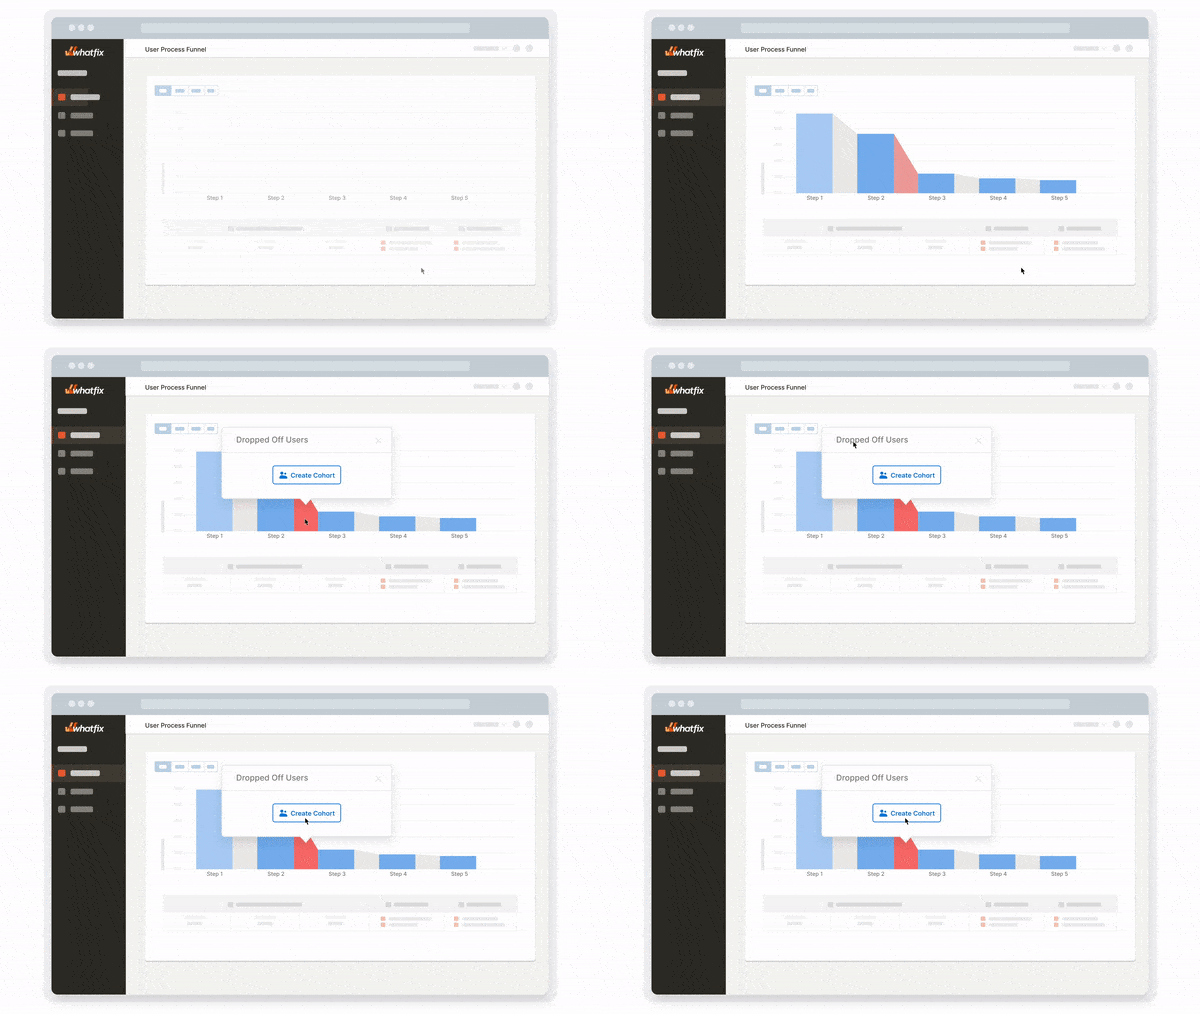
User drop-off rate track where your customers or visitors are exiting your app or website after starting to engage. For example, if a user begins filling out a form but doesn’t complete and submit that form, it would count as a user drop-off.
Measuring user drop-offs helps you identify gaps in your funnel, areas where your users might need more clarification or support, product bugs, and areas of user friction.
You want your users to engage with your help content, but if they’re spending too much time reading how-tos or support materials, it could be a sign that your onboarding process is missing the mark or your product is overly complex.
Measuring users’ help content consumption can help you find common questions amongst your users so you can improve your product. Product teams can track and analyze how users consume and engage with help content in your in-app resource center, knowledge base, customer community, and other customer-facing knowledge repositories.
PRO TIP
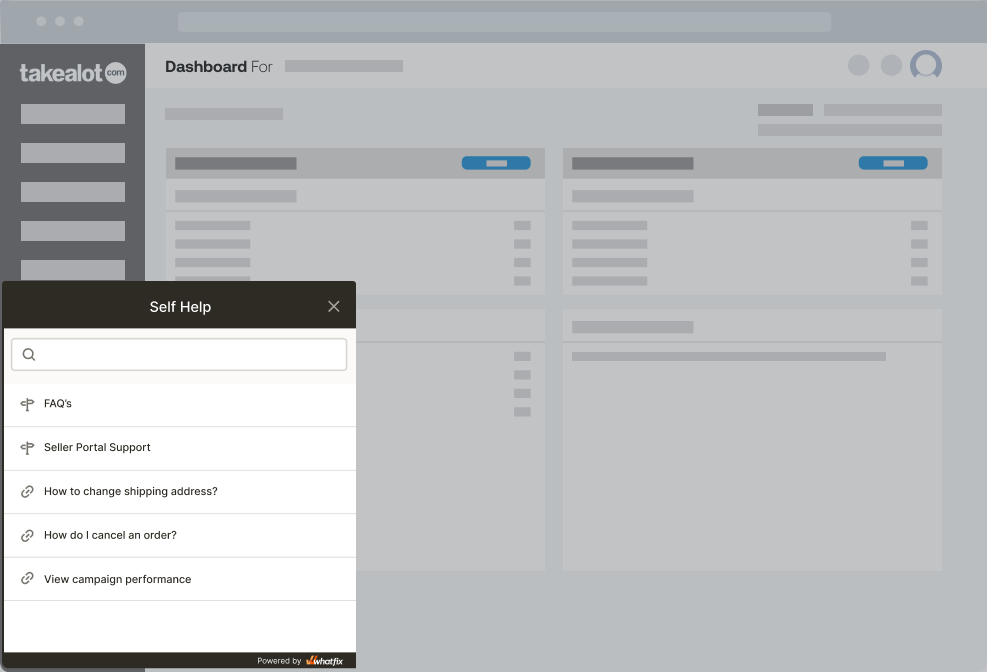
With Whatfix DAP, enable your customers and users with on-demand support via Self Help. Self Help integrates with your knowledge repositories, including your knowledge base, FAQs, customer LMS, video tutorials, and more – aggregating and curating it into an in-app help center that overlays your product. Users can search for any contextual issue they’re experiencing. Self Help analytics track the most searched help queries, providing insights into what new support content you should create, UX improvement areas of your product, and general areas users experience friction.

In order to grow, you need to retain customers. Customer retention rate tells you how many of your users are sticking around from month to month or year to year. To find customer retention rate, use this formula: Customer retention rate = (End number of customers – New customers gained) / Starting number of customers
Customer retention rate is one of the most valuable metrics for user engagement because it shows how well you meet existing customer needs. If your retention rate is low, you’re missing the mark, and it’s time to conduct a retention analysis to find out why.
Support ticket volume tells you how many help requests your customers are submitting.
While you want your customers to be able to ask for support when they need it, a high volume of tickets could indicate that your product is too complex or your onboarding process isn’t working. It may also push your support team to consider a support ticket prioritization strategy to help them resolve more critical tickets first.
Support tickets can also be an early sign that a function or feature is broken. An unexpected spike in tickets will alert you that there is something your engineering or product team needs to fix.
For websites, track and analyze basic visitor engagement metrics like pageviews, time on page, page per session, and scroll depth to understand traffic acquisition channels, where users are coming from, how engaging your content is, and how users consume your content.
In this section, we’ll dive into the practical ramifications of user engagement, specifically, how certain industries measure (i.e., common user engagement metrics), optimize for it, and their general approach to user engagement.
E-commerce brands like Amazon, Wish, Alibaba, and Walmart must keep users browsing around long enough to find products they love, add as many as possible to a cart, and check out immediately—or return at a better time to complete their purchase.
To maximize the chances of having those outcomes, digital retailers track metrics like:
Additional edge cases to consider include Alibaba’s livestream shopping which measures engagement with metrics like comments, purchases, and viewer counts, and eBay’s auction model which emphasizes bids submitted and successful auction completion rates.
B2B software applications like HubSpot, Mailchimp, and Salesforce use end-user monitoring to determine when users need to be re-engaged, if their product’s onboarding process needs to be reworked, issues with enterprise UX design, and product health metrics that might signal that users are facing issues, such as:
Consumer applications (Uber, Apple Fitness, Headspace, Instacart, Facebook, and Twitter) cater directly to individuals and as such, they’re more likely to lose users who churn on a whim. Consequently, they must keep tabs on activity metrics, track usage over time, and if/how much of their network they invite to share the experience with.
For instance:
Netflix, Peacock, Disney+, Hulu, and Prime Video need to immerse users, get them to complete more shows, keep going down the rabbit hole (with newer shows), and even create their own playlists/wish lists.
Methodologies for measuring user engagement typically involve advanced data analytics, machine learning, and recommendation algorithms to personalize the user experience. A/B testing and experimentation are also used to optimize the platform for engagement.
Some edge cases to consider:
At first, “How do we improve user engagement?” sounds almost rhetorical—how else but by building a better product people want to use?
Instead, we focus on the tips, optimization best practices, and UX philosophy to adopt across your user onboarding experience to create a sticky product and drive product adoption.
User personas help you sketch a profile of what your ideal user(s) look like so you can optimize your product to their use cases and get them to engage more often. Depending on your industry, niche, and target user base (i.e., B2B/B2C), your persona-building might need to factor in:
On the other hand, cohort analysis refers to grouping users into buckets based on their shared characteristics such as sign-up date, acquisition channel, location, product version, subscription type, and engagement frequency.
The goal is to observe users who share certain behavioral traits, understand their usage patterns, and discover engagement aids to help them explore your product deeper.

Self-help end-user support resources like support content libraries, wikis, pre-recorded demos, courses, knowledge bases, product documentation, and digital communities enable users to quickly ramp up their usage of your product at their own pace.
With a digital adoption platform like Whatfix, product teams can enable their end-users with an embedded self-help wiki that overlays their application UI. Whatfix Self Help automatically crawls a product’s documentation, tutorials, video repos, knowledge base, FAQs, and more – aggregating all help and support content into one searchable wiki.
In-app guidance experiences offer contextual support—they surface useful tips, cues, and highlights right when users need them and, as a result, make it easier to navigate your product without engaging support.
A guided onboarding, engagement, and adoption platform like Whatfix enables your with a no-code editor to create, launch, test, and analyze in-app guidance cues and messages such as:
Takealot is South Africa’s largest online e-commerce marketplace with 10,000 active sellers on the platform, uploading products and maintaining an online store. To keep up with all new sellers, Takealot used Whatfix to create a user onboarding experience that guided new users with in-app tutorials for setting up their seller profiles, uploading their first products, and video resources on how to make their first sale.
With Whatfix, Takealot reduced its time-to-value by 600% for new sellers and decreased onboarding time-to-completion from 30 to 5 minutes. It also improved seller profile completion and product description quality, deflected 130,000+ support tickets, and uncovered friction areas in its seller experience via Guidance Analytics and Surveys.


Product analytics platforms (like Whatfix Analytics) offer the most transparent way to observe your users’ behavioral patterns, detect issues they might be facing, and marginal changes that can improve user experience.
And, speaking of product analytics, there are different approaches you can take and metrics you might track with a tool like Whatfix, such as:
Although user feedback doesn’t directly impact engagement metrics significantly, it helps you understand what to change about your product to improve user experience and what features your end-users are requesting the most. In practice, you can insert these survey and feedback prompts after pillar experiences when users are more likely to respond honestly.
There are several channels product-led companies can use to collect product feedback, including:
A culture of continuously experimenting with variables will help your product team observe how real users interact with your product vs. what you expect, ensure that your messaging is clear and aligns with user expectations, and helps you to deploy user paths that guide users to their desired outcomes faster.
One effective user path to analyze, optimize, and continuously test is your onboarding experience. User onboarding flows should guide users to relevant information or assist them within your application based on their current context, desired outcome, or needs. As a result, you’ll be able to reduce friction, reduce your time-to-value, increase feature adoption, and retain more users.
A digital adoption platform (DAP) like Whatfix empowers product managers to build in-app guidance in a no-code editor, such as product tours, onboarding flows, new feature walkthroughs, announcements, tooltips, self-help wikis, and more to improve the overall user experience and contextualize it to certain user cohorts.
Whatfix is an all-in-one growth engine designed to help product-led teams understand their users, educate them at scale, and build loveable experiences.
Learn how Whatfix can help you build engaging product experiences with our user engagement platform that’s designed for scale.

Thank you for subscribing!
