


Every interaction inside a product shapes the user’s perception of its value. When friction occurs, it hinders adoption and breaks user productivity. Product teams that prioritize frictionless experiences turn insights into impact, ensuring every click, tap, or scroll brings users closer to success.
Product analytics enables that precision. These platforms track user behavior across features and workflows, revealing where engagement is most effective and where users encounter challenges. By combining qualitative insights with quantitative data, product analytics tools help teams understand how users engage, what blocks them, and which product improvements will drive measurable outcomes.
Modern product analytics software has evolved far beyond simple event tracking. Category-leading vendors now provide holistic ecosystems for product owners, combining analytics with built-in tools for creating in-app guidance, contextual help content, and user engagement campaigns. With the integration of AI, these systems proactively surface friction trends, uncover behavioral patterns, and recommend improvements before they affect KPIs.
Real-time data access enables agile decision-making, while enterprise-grade compliance standards, such as SOC 2, GDPR, CCPA, and HIPAA, protect user data and maintain organizational trust. Together, these capabilities make today’s product analytics software indispensable to any product or transformation team focused on delivering exceptional experiences across internal and customer-facing applications.
In the sections ahead, we’ll explore the key features and functionalities of top product analytics software, analyze the best tools available today, and explain why Whatfix Product Analytics stands out as the leading choice for enterprise teams building high-performing digital products.
What are the top product analytics platforms in 2026?
Key Features for Evaluating Product Analytics Software
Choosing the right product analytics platform begins with understanding the essential capabilities that enable product teams to collect, interpret, and act on user data. While every tool promises insights, only those with robust functionality and an accessible design empower both technical and non-technical users to translate analytics into measurable improvements.
Core features to evaluate product analytic tools include:
- Event Tracking: The foundation of any product analytics platform. Event tracking captures every user interaction—clicks, page views, form submissions, and custom events. The best tools offer no-code implementation, allowing product managers and analysts to define and track key actions without engineering support, while still providing developer-friendly options for organizations that prefer advanced instrumentation.
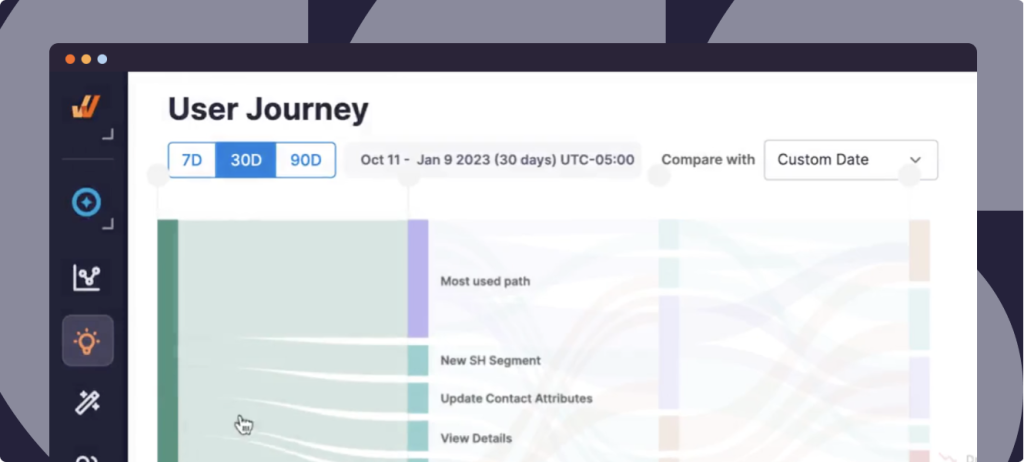
- Funnel and Retention Analysis: Funnel reports visualize user journeys across steps, revealing where drop-offs occur and which behaviors correlate with conversion. Retention analysis complements this by showing how often and how long users return, helping teams identify patterns of sustained engagement or churn.
- User Segmentation: Segmentation allows teams to filter and analyze behavior by cohort—user type, role, plan tier, geography, or lifecycle stage. It turns aggregate data into actionable insights, making it possible to tailor experiences and improve adoption across specific audiences.
- Session Replay: Session replays provide qualitative context behind quantitative metrics by allowing teams to view exactly how users navigate the application. This visibility helps diagnose UX friction, identify confusing interactions, and validate hypotheses from event data.
- A/B Testing: Experimentation features let product teams compare different experiences or workflows in controlled tests. They provide evidence-driven validation for design or feature decisions, reducing reliance on intuition and supporting a culture of continuous iteration.
- Heatmaps combine multiple user sessions and show you the parts of your website (or application) users interacted with most and least by shading them with color codes. Heatmaps track scroll depth, clicks, taps, and mouse hovering.
Modern, holistic product analytics platforms extend well beyond these foundational capabilities. Advanced systems now equip product and application owners with additional features such as:
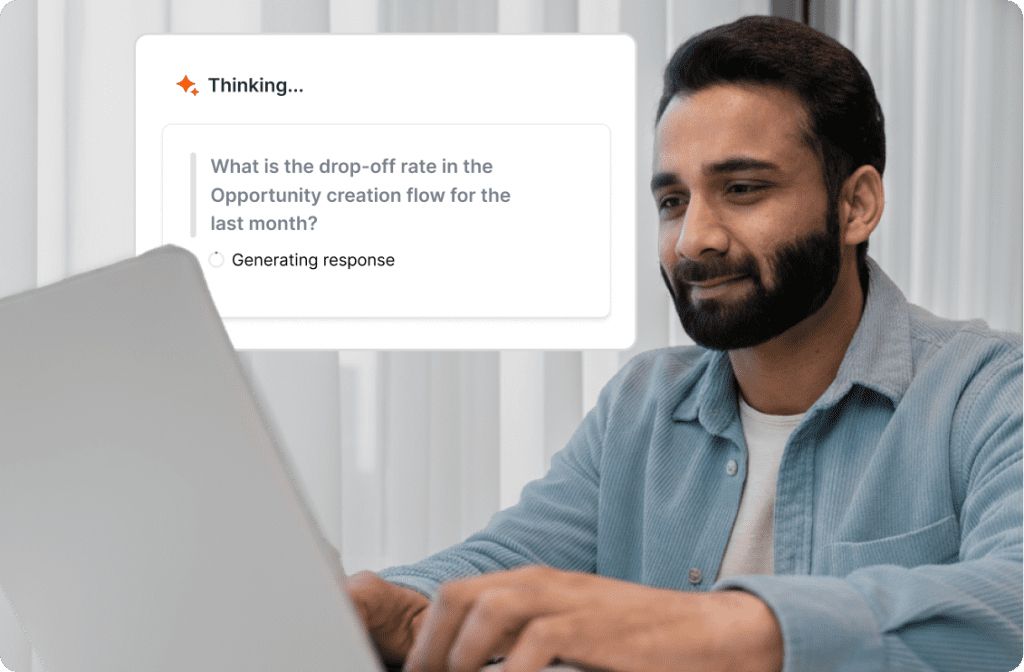
- AI Insights for automated trend detection and anomaly reporting
- In-App Guidance for creating contextual walkthroughs, tooltips, and nudges directly within the application
- In-App Surveys for collecting real-time user feedback to complement behavioral data
- Integrations with CRM, help desk, collaboration, and data visualization platforms to unify insights across teams
These expanded capabilities transform product analytics software from diagnostic tools into complete product experience platforms. They bridge the gap between insight and action—allowing teams to both understand and improve the digital journey within a single system.
10 Best Product Analytics Tools
The product analytics market is crowded with vendors promising better insights, faster decisions, and frictionless digital experiences. In fact, over 110 product analytics software vendors are listed on G2, each claiming to help organizations understand user behavior and improve adoption. But the real challenge for product leaders isn’t finding tools, it’s finding platforms that deliver measurable outcomes, scale with enterprise needs, and integrate seamlessly with existing technology stacks.
The following list highlights the top product analytics software, each evaluated for its ability to combine behavioral data, user experience insights, and enterprise-grade reliability.
1. Whatfix Product Analytics
- Review Rating: 4.6 out of 5 stars
- Best for: Enterprise organizations seeking a unified analytics and digital adoption platform (DAP).
- Get a Demo
Whatfix Product Analytics combines behavioral data with in-app engagement tools to provide product owners and transformation leaders with a comprehensive view of how employees and customers interact with software. Unlike traditional analytics tools that focus solely on event tracking, Whatfix unifies product analytics, digital adoption, and real-time guidance within one platform.
With no-code event tracking, teams can define user actions without relying on developers, while built-in AI insights automatically surface friction points, drop-off points, and opportunities for improvement. These insights directly inform Whatfix’s creation of new in-app content, including Flows, Smart Tips, Pop-Ups, and Task Lists, enabling teams to act immediately by creating targeted walkthroughs and support content to resolve issues identified in the data.
Key Features:
- Unified analytics and in-app guidance platform for an all-in-one platform to track behavior, target friction, and optimize the product experience.
- No-code event tracking (Autocapture) and advanced user segmentation (Cohorts).
- Session replay to see what your users see.
- AI Insights Agent proactively identifies friction areas and triggers AI Authoring agents to create new in-app guidance.
- In-app feedback tools to collect user feedback within your application.
- Secure enterprise-grade compliance (SOC 2, GDPR, CCPA, HIPAA)
- Integrations with CRM, LMS, analytics, and ITSM tools
Why It Stands Out: Whatfix bridges the gap between insight and action, enabling organizations to not only understand user behavior but also improve it in real time. This combination of analytics, engagement, and enablement gives enterprises the control they need to accelerate software adoption, optimize workflows, and deliver measurable ROI from digital transformation initiatives.
Request a Whatfix Analytics Demo
2. Amplitude
- Review Rating: 4.5 out of 5 stars
- Best for: Product-led teams seeking powerful behavioral analytics and experimentation.
Amplitude is a category leader in product analytics known for its deep behavioral data visualization, cohort analysis, and predictive insights. It helps teams understand how users engage with specific features and where retention drops across the product lifecycle. Amplitude’s Data Graph connects disparate user events into unified journeys, giving teams an end-to-end understanding of engagement patterns.
Key Features:
- Robust event tracking and funnel visualization
- Advanced cohort and retention analysis
- A/B and multivariate testing capabilities
- Predictive analytics and AI-driven forecasting
- Integrations with data warehouses and marketing tools
Why It Stands Out: Amplitude excels at enabling product-led growth (PLG) organizations to link product engagement with business outcomes. Its advanced analytics and experimentation suite make it ideal for teams operating at scale with complex user journeys.
3. Pendo
- Review Rating: 4.4 out of 5 stars
- Best for: Organizations seeking analytics combined with in-app engagement and feedback tools.
Pendo brings together product analytics, in-app messaging, and customer feedback collection in one unified platform. It enables product managers to measure feature adoption, segment users, and create guided experiences that drive engagement. Its no-code tagging makes it easy for non-technical teams to implement tracking and build walkthroughs without engineering resources. Pendo’s strength lies in combining quantitative analytics with qualitative insights from in-app feedback. This makes it a powerful choice for teams that want to understand user intent and directly influence engagement within the same system.
Key Features:
- No-code event tracking and user tagging
- In-app onboarding and messaging
- User feedback polls and surveys
- Product adoption dashboards
- Integrations with Salesforce, Zendesk, and Slack
4. Mixpanel
- Review Rating: 4.6 out of 5 stars
- Best for: Fast-moving teams that need real-time, self-serve analytics.
Mixpanel helps product and growth teams analyze user behavior in real time. Its event-based model allows teams to build dynamic reports and dashboards without SQL, while interactive cohorts enable flexible exploration of how users convert or drop off. Mixpanel’s speed and ease of use make it ideal for agile teams focused on iteration and experimentation. Mixpanel remains one of the most user-friendly analytics tools for fast experimentation and rapid insight generation. Its real-time capabilities support teams that depend on speed and agility for decision-making.
Key Features:
- Real-time event tracking and dashboards
- Funnel and retention analysis
- Advanced cohort segmentation
- Interactive reports with drag-and-drop UI
- API and warehouse integrations
5. Heap
- Review Rating: 4.4 out of 5 stars
- Best for: Teams that want automatic event tracking without manual setup.
Heap (now a Contentsquare product) captures every user interaction automatically, eliminating the need for predefined event tracking. This autocapture model makes it easy for teams to retroactively analyze user behavior, even when events weren’t initially defined. Combined with Journey Maps and Effort Analysis, Heap enables a comprehensive understanding of user friction and experience quality. Heap’s auto-capture technology removes setup friction, giving product and analytics teams immediate visibility into user behavior. It’s especially valuable for organizations looking to accelerate insights without deep technical overhead.
Key Features:
- Automatic event capture (no manual tagging)
- Journey mapping and path visualization
- Funnel and retention analysis
- User effort scoring
- AI-powered insights and anomaly detection
6. PostHog
- Review Rating: 4.5 out of 5 stars
- Best for: Product-led startups and engineering teams that prefer self-hosted, open-source analytics.
PostHog is an open-source product analytics platform that provides flexibility and control over data ownership. It offers event tracking, funnel analysis, and session recording, along with self-hosted deployment options for privacy-conscious organizations. PostHog also integrates experimentation and feature flagging into its core platform. PostHog combines developer flexibility with enterprise-grade analytics, making it an excellent choice for teams that want transparency, customization, and complete control over their data.
Key Features:
- Open-source and self-hosted options
- Event and funnel tracking
- Session recording and heatmaps
- Feature flagging and A/B testing
- Plugins and API customization
7. FullStory
- Review Rating: 4.5 out of 5 stars
- Best for: UX and digital experience teams focused on qualitative insights and behavioral replay.
FullStory blends product analytics with session replay and digital experience intelligence. It provides granular behavioral data alongside full replays of user interactions, helping teams uncover where users get stuck or abandon workflows. FullStory’s machine learning models also detect patterns of rage clicks, dead links, and UI frustration. FullStory goes beyond traditional analytics by pairing numbers with narrative. Its visual replays give teams the “why” behind user behavior, making it a preferred choice for UX-focused organizations.
Key Features:
- Session replay and heatmaps
- Frustration signal detection (e.g., rage clicks)
- Event tracking and user segmentation
- Funnel visualization and conversion tracking
- Integrations with analytics, ticketing, and collaboration tools
8. LogRocket
- Review Rating: 4.6 out of 5 stars
- Best for: Engineering and product teams diagnosing user-facing performance and UX issues.
LogRocket focuses on combining product analytics with front-end performance monitoring. It records sessions, tracks errors, and visualizes how performance issues affect user behavior. By bridging product data with technical telemetry, LogRocket helps teams resolve UX friction caused by bugs, slow rendering, or broken interactions. LogRocket gives engineering and product teams a shared view of both user experience and technical performance, helping accelerate debugging and improve overall product quality.
Key Features:
- Session replay with console and network logs
- Error tracking and performance metrics
- Event and funnel analytics
- Integration with tools like Jira, Datadog, and Sentry
- AI-assisted issue detection
9. Quantum Metric
- Review Rating: 4.6 out of 5 stars
- Best for: Enterprise organizations focused on continuous product design (CPD) and optimization.
Quantum Metric provides a digital analytics platform built around Continuous Product Design, enabling teams to measure customer behavior and iterate quickly based on insights. It blends real-time data with qualitative session replays and anomaly detection, giving enterprises a clear picture of how digital experiences perform at scale. Quantum Metric’s focus on continuous iteration and large-scale data visualization makes it a top choice for enterprise teams managing multiple digital touchpoints and customer journeys.
Key Features:
- Continuous Product Design (CPD) framework
- Real-time analytics and session replay
- AI-driven anomaly detection
- Conversion funnel and retention analysis
- Enterprise compliance and data governance
10. Glassbox
- Review Rating: 4.9 out of 5 stars
- Best for: Enterprises prioritizing digital experience analytics and customer journey optimization.
Glassbox delivers deep visibility into digital experiences across web and mobile. It captures every interaction to create real-time session replays, heatmaps, and conversion insights, helping organizations identify experience gaps and compliance risks. Glassbox’s AI capabilities automatically highlight friction and performance bottlenecks affecting customer outcomes. Glassbox provides a powerful combination of behavioral, experiential, and compliance analytics—helping large enterprises design digital experiences that are both intuitive and compliant with global standards.
Key Features:
- Full-session recording and playback
- Heatmaps and conversion analysis
- AI-driven experience scoring
- Customer journey analytics
- Privacy and compliance controls
How to Choose a Product Analytics Software Provider
Selecting the right product analytics software requires more than comparing dashboards or pricing tiers. The best choice depends on your organization’s technical maturity, data governance standards, and the type of applications you manage—whether customer-facing products, employee-facing business systems, or both. The right platform should not only help you understand user behavior but also empower you to act on it within the same ecosystem.
Below are key considerations when evaluating providers, and how Whatfix Product Analytics delivers on each.
Setup and Implementation
Assess how easily your team can implement event tracking and begin collecting actionable data. Some platforms require developer-led instrumentation for every tracked event, while others offer no-code or low-code configuration. Consider whether your organization needs flexibility to track custom events or define data parameters based on specific use cases or workflows.
Whatfix Product Analytics provides a no-code setup that enables product managers and application owners to tag custom events directly through an intuitive interface. For complex enterprise systems, Whatfix also supports technical configuration via APIs and SDKs, giving product owners complete control where needed. This dual approach accelerates implementation while maintaining analytical precision.
Real-Time Analytics and Retroactive Data
Data freshness is critical for agile product teams. Look for tools that offer real-time dashboards for ongoing initiatives and retroactive data capture, allowing you to analyze behaviors before specific events are defined. Together, these capabilities create a continuous feedback loop for optimization.
Whatfix delivers real-time analytics to help teams monitor engagement as it happens and measure the impact of recent releases or workflow updates. Its retroactive data tracking ensures teams never lose insight, even if a user journey wasn’t tagged in advance. This gives digital transformation leaders confidence in their data continuity and decision-making.
AI Capabilities
AI should simplify discovery and behavior tracking, not complicate it. The best product analytics tools utilize AI to identify hidden friction points, predict behavioral drop-offs, and recommend targeted optimizations. Evaluate how a platform’s AI features integrate with your team’s workflows rather than operate as standalone add-ons.
Whatfix integrates AI-powered insights directly into its analytics dashboard, automatically identifying patterns like workflow friction, disengagement trends, and training gaps. These insights translate into actionable next steps, allowing teams to deploy targeted in-app interventions within minutes—without needing data science resources.
Built-In Capabilities for In-App Guidance and Just-in-Time Help
Analytics without enablement leaves teams guessing. Platforms that include in-app guidance, walkthroughs, or contextual help content allow teams to close the feedback loop faster—turning insight into immediate action.
Whatfix uniquely combines product analytics with a comprehensive digital adoption suite. Once a friction point is identified, teams can instantly deploy contextual Flows, Smart Tips, Pop-Ups, or Self Help widgets within the same platform. This direct connection between analytics and enablement makes Whatfix a complete system for continuous improvement.

Web, Mobile, or Desktop Application Tracking
Determine which environments your users operate in—web, mobile, or desktop—and ensure your analytics platform supports all of them with equal reliability. Enterprise organizations often run hybrid ecosystems across internal and external systems, so multi-platform visibility is essential.
Whatfix supports multi-environment tracking, providing unified analytics across web, mobile, and desktop applications. This cross-platform capability is particularly valuable for organizations with diverse tech stacks and multiple user types, ensuring consistent insights across every touchpoint.
Integration Needs
A product analytics platform should fit seamlessly into your existing ecosystem. Evaluate integrations with your CRM, analytics warehouse, ticketing, collaboration, and learning systems. Integration flexibility determines how effectively you can operationalize insights across teams.
Whatfix integrates with a wide range of enterprise tools, including Salesforce, ServiceNow, Workday, Zendesk, and Power BI, enabling synchronized analytics, performance reporting, and workflow automation. These integrations help enterprise leaders link behavioral data to organizational KPIs and transformation outcomes.
Why Whatfix Product Analytics Leads the Market
Enterprise product and application owners don’t just need more data, they need the power to act on it. Most analytics platforms stop at observation. Whatfix Product Analytics goes further by turning insight into immediate action.
Whatfix Product Analytics is the only enterprise-grade platform that unifies behavioral analytics, AI-powered insights, and in-app enablement into a single, cohesive system. It eliminates the fragmentation between data collection, analysis, and user experience improvement, giving teams end-to-end visibility and control over how employees and customers interact with software.
Here’s what sets Whatfix Product Analytics apart:
- Unified Platform: Whatfix combines product analytics with its leading digital adoption suite, empowering teams to both identify and resolve friction within the same ecosystem—no third-party toolchains, no disjointed workflows.
- No-Code and Developer-Ready: Business users can configure event tracking and deploy in-app guidance without engineering dependency, while technical teams retain complete control through APIs and SDKs.
- AI-Driven Insights: Built-in intelligence identifies engagement drop-offs, workflow friction, and training gaps, automatically surfacing optimization opportunities that drive measurable improvement.
- Real-Time Visibility: Instant data refresh ensures application owners always have an accurate, up-to-the-minute understanding of user behavior and adoption patterns.
- Compliance-Ready: Enterprise-grade security and governance with SOC 2, GDPR, CCPA, and HIPAA certifications ensure data integrity and user trust at scale.
- Cross-Application Reach: From SaaS to desktop to custom-built enterprise tools, Whatfix tracks and optimizes user experiences across every layer of your digital ecosystem.
Digital adoption doesn’t happen through dashboards; it happens through guided, data-informed action. Whatfix Product Analytics is purpose-built for enterprise organizations that need to move fast, reduce friction, and prove ROI across every digital initiative. It’s more than an analytics platform; it’s a performance engine for application owners, IT teams, and digital transformation leaders who want to drive meaningful, measurable change.
With Whatfix, insights become the foundation of better software experiences, higher adoption rates, and stronger business outcomes.