


Modern business activities and customer transactions are executed through digital experiences, like an application or website. But despite technology integrating itself more assertively into our day-to-day interactions and workflows, there’s a catch.
While technology can enable end-users to become more efficient and productive, it’s not always straightforward for end-users (whether that’s customers or employees) to use and maximize their usage.
This has led to creating help desk teams for external customer support issues and internal IT-related technical support. The reliance on these help desk teams is growing, with 56% of enterprises bracing themselves for increased support requests in the coming year.
What can you do about it?
In this article, we’ll review the most common help desk ticket issues and provide solutions to enable your internal help desk and customer support teams with the knowledge, tools, and strategies to overcome them proactively.
TL;DR / KEY TAKEAWAYS
→ More than half of enterprises expect ticket volume to rise, which means IT needs a plan to manage the load.
→ Password resets remain the top request, showing the value of simple self-service.
→ About 67% of employees report device issues, which highlights how much downtime comes from preventable problems.
→ Poorly managed access requests slow work and add to backlogs.
→ Self-help tools and in-app guidance reduce routine tickets and free IT for higher-value work.
What are the most common help desk support issues?
- Password reset requests
- Software installation and update errors
- Connectivity issues
- Email-related problems
- Hardware malfunction reports
- Access issues to shared resources
- Performance complaints
- Software bug reports
- Data loss or retrieval requests
- Device onboarding and configuration challenges
- License and subscription management
- System crash and reboot issues
- User role and permission changes
13 Most Common Help Desk Issues Raised in Support Tickets
While every organization’s help desk and customer support team will face contextual issues to their industry, niche, size, and more, these eleven support issues are frequently encountered by help desk teams supporting internal employees or external customers and end-users.
1. Password reset requests
A survey by ExpressVPN found that 52% of respondents in the United States lose their passwords at least once a month. Most of us can relate to this predicament and can likely recall a time when we’ve frustratingly attempted to log into our accounts over and over again — sometimes up until the point that we’re locked out of essential systems altogether. What do users tend to do when this happens?
You guessed it — submit an IT support ticket.
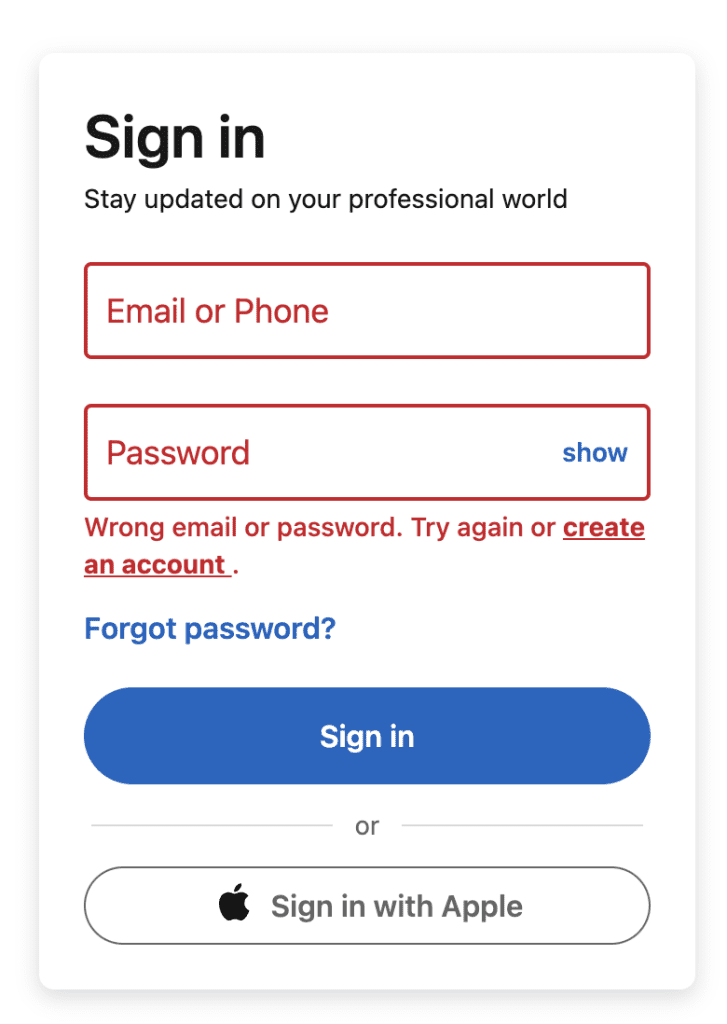
Organizations are responsible for creating seamless password reset flows within products and services so users don’t have to rely on additional password management tools or dependencies on other people to log back into an application. Teams can significantly reduce the number of password reset requests and shorten the time taken for users to reset passwords by creating a quick and easy self-service channel to resolve this issue.
Today, users typically expect to see this prompt to reset their password during the login process:
Don’t assume all your users know how to find and use this prompt. Document this self-service flow in your knowledge base so users can quickly look it up and find a helpful article. The example below shows how Whatfix gives our customers an intuitive search experience that automatically surfaces related articles based on keywords in the search bar.
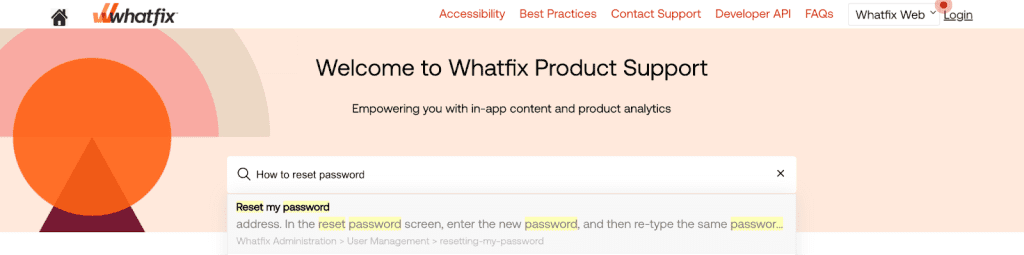
With a digital adoption platform like Whatfix DAP, organizations can embed a self-help wiki over customer-facing and internal applications that aggregate all end-user documentation, knowledge base articles, FAQs, process docs, videos, and more into one searchable interface. End-users are contextually shown support resources based on where they are in an application, which prompts in-app guided experiences that walk users through issues and help them solve help desk issues on their own.

2. Software installation/update errors
The software applications we use today are more advanced and comprehensive than ever. From solutions enhanced with emerging technologies like AI and RPA to platforms built with extensive customization functions, consumers today have no shortage of options to implement personalized solutions for their specific needs. But with more software maturity comes more complex installation and update processes. Customers often submit help desk tickets to solve challenges such as software that fails to install properly, freezes during or after updates, crashes, or runs into corrupted files and programs.
To resolve these issues, customer support representatives can educate customers on user permissions and system compatibility. An organization delegates user permissions to ensure employees can install and update software.
Train them to handle these processes and stay on top of assessing hardware and software requirements before making any changes to the system. Opening this responsibility up to everyone increases the risk of errors because not everybody will have the in-depth IT training and familiarity to complete it correctly.
3. Connectivity issues
Network outages have become more frequent in recent years, with 44% of data center operators growing more concerned about the resilience of IT services. Customers will turn to help desks if they encounter problems like slow, inconsistent, or limited network connections to specific locations, websites, and devices.
Failure to resolve these connectivity issues efficiently will drive customers away and dwindle growth opportunities. “Network outages lasting mere minutes can mean millions or billions of dollars in lost revenue, reputational damage, and recovery efforts,” Song Pang, senior vice president of customer engineering at NetBrain, writes for Forbes.
Organizations can better manage network interruptions by implementing preventative measures like continuous monitoring and dedicating a schedule to maintain network devices like routers and modems. Making network troubleshooting knowledge accessible to more stakeholders and easier to digest can also decrease the time spent resolving tickets.
4. Email-related problems
The number of individuals using email is expected to reach close to 4.6 billion in 2025, making it one of the most popular digital communication methods.
Email is easy to access and requires little resources to use and scale, attracting users across age groups, digital proficiency levels, industries, and company sizes. But this lower barrier to entry can also make it difficult for email providers to enforce user education and troubleshooting guidance at scale.
This leads to high volumes of support requests for issues like:
- Server errors that prevent users from sending and receiving emails
- Difficulty setting up and syncing data from an email account to a new device
- Inability to log into an email server
- Compromised email accounts due to hacks, excessive spam, or phishing attempts
The inability to access email functionalities properly can significantly impede business continuity — it halts communication, puts processes at a standstill, and delays decisions.
Implementing standardized email configurations and settings can help companies avoid the hassle of waiting for IT to solve email tickets. Develop and distribute clear email guidelines that outline policies for security and privacy, email data backup systems, email templates, server updates, employee feedback collection, and more.
5. Hardware malfunction reports
Employees submit hardware malfunction reports when their devices are slow, broken, or incapable of performing important tasks properly.
A 2022 study of workers in the United Kingdom found that 67% of employees were experiencing device issues, like laptops and keyboards. These issues dampen productivity, create friction in the employee experience, and reduce trust in leadership.
Support tickets reporting malfunctioning office hardware include problems with hard drives, network connectivity, laptops, and desktop monitors that randomly shut down, restart, and overheat.
Your organization’s IT departments can create a strategy that minimizes disruptions from hardware issues by prioritizing preventative measures such as regular maintenance and updates and hardware monitoring systems that alert responsible parties when an abnormality is detected on company devices.
IT teams can also equip employees with resources and best practices to help them keep devices up-to-date and protected.
For example, companies can document guidelines on downloading software and files onto a device, charging and handling devices, and maintaining clean workplaces to avoid unwanted damage.
6. Access issues to shared resources
Siloed information is a rampant problem in the modern digital workplace, with 60% of employees finding it difficult to get essential information from colleagues and do their most productive work. Companies could overcome this problem by using shared drives, knowledge bases, and project management software to make information easier to locate and share among team members.
But what happens when these systems don’t give employees the convenience they were promised? It becomes a technical issue that requires intervention from leaders, operations teams, or IT departments.
Many of these issues stem from outdated access control lists that prevent operations managers from giving the right people the necessary permissions. As your organizational structure shifts and grows, you’ll want to create a system for maintaining these access control lists to reflect changes such as new hires, resignations, promotions, evolving job descriptions, and more.
Here are a few tactics you can use to prevent unnecessary tickets for these issues:
- Clearly define requirements for each shared resource
- Assign users specific permissions based on their roles and responsibilities
- Use self-service portals and automated workflows to allow employees to submit access requests and get automatic approvals based on pre-defined criteria
- Create end-user training and education content that helps familiarize themselves with security and permission requirements
With a digital adoption platform (DAP) like Whatfix, organizations can ensure employees seamlessly navigate internal software applications and digital processes, reducing friction and frustration when accessing shared resources. Whatfix Self Help enables employees to instantly find relevant support documentation, FAQs, and troubleshooting guides within the application, eliminating the need to submit tickets for routine access issues.

For more complex access challenges, Whatfix’s in-app guidance provides step-by-step, interactive walkthroughs that guide users through permission requests, access approvals, and security protocols in real-time, ensuring they follow the correct process without needing IT intervention.
Whatfix’s automation and contextual nudges can also proactively surface reminders to update access control lists, helping IT teams avoid permission-related bottlenecks as organizational structures evolve.
7. Performance complaints
Much like help desk tickets for hardware malfunctions and connectivity issues, performance complaints revolve around requests to fill user experience gaps in digital devices and systems. The biggest difference is that these requests are more closely tied to an employee’s ability to perform a task efficiently with the necessary software or process,
Let’s break this comparison down. An employee would submit a hardware malfunction ticket if their office-issued laptop shuts down frequently without warning. They would submit a ticket for connectivity issues if they can’t access a stable and strong internet connection.
However, they would submit a performance complaint if their cloud-based enterprise software takes too long to load a specific dashboard, impacting their ability to collaborate with team members and move a task forward.
8. Software bug reports
Software users submit bug reports to help desks when encountering errors in their digital applications or devices. Bugs are a natural part of coding and can happen to any product, regardless of its sophistication or organization.
Coming across a few bugs now and then isn’t detrimental to the user experience — but it can be if companies don’t prioritize regular updates and patches in their development lifecycle.
IT and customer support teams deal with tickets reporting bugs such as unresponsive software, sudden crashes, user interface abnormalities, functionality errors within software features, and more. These issues are disruptive and can completely halt a user’s workflow.
If your UI/UX designers can’t log onto their design tool without it freezing and crashing, their work gets pushed back for hours or days until their ticket is solved. Companies can avoid this worst-case scenario by implementing continuous, real-time monitoring, crisis management processes, alerts, and training content to educate users about necessary software updates.
9. Data loss or retrieval requests
A study of computer owners found that 62% had lost their data before, while 61% lost their data due to a security accident. With the frequency of cyberattacks and the growing number of software applications consumers use daily, data security and protection will only become a more significant focus area for all organizations.
Although it’s crucial to equip help desks with the resources to support data loss and retrieval requests, risk mitigation efforts will be the most effective. Data that’s lost is extremely challenging to get back.
Teams must equip their data infrastructures with automated backup systems, which gives technical and non-technical users a simple way to adopt a “set it and forget it” approach to data backups. Beyond that, product and customer support teams must define a data recovery process to help users retrieve sensitive and vital data.
10. Device onboarding and configuration challenges
Device onboarding and configuration issues happen when users struggle to set up their devices for intended use. This is common in workplaces, considering employees’ different levels of familiarity and proficiency with device settings and software.
Conducting onboarding and configuration can be even more complex for companies with a remote or hybrid work model. The last thing you want is for new hires to be stuck waiting for help desk tickets to be resolved on their first day.
Standardizing device onboarding and configuration processes will save companies the time and hassle of one-on-one meetings, live training, and back-and-forth messages. Document these processes into your knowledge base, categorize them clearly, and make them accessible to employees anytime.
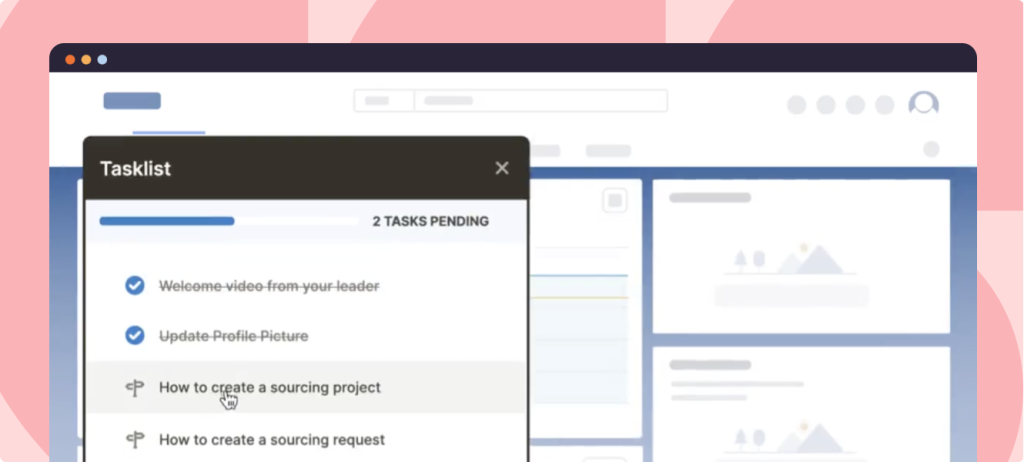
You can even surface self-service channels like task lists and searchable resource centers within your workforce management software to make these processes visible throughout onboarding.
11. License and subscription management
Research by the Harvard Business Review found that employees today toggle between digital applications 1,200 times daily, adding up to under four hours of toggling a week. This may not be surprising, considering the average department uses 40 to 60 tools.
That’s a lot of tools to manage, many licenses to stay on top of, and many support tickets sent out regarding license renewals, permissions, and activation.
For example, an expired subscription or overused software license will lock users out and interrupt their work while they wait to hear back from customer support representatives. Organizations can avoid these bottlenecks by using software license management tools to automate processes like renewals, monitor license usage, log records of all subscriptions, and manage permissions.
12. System crash and reboot issues
Few things are more frustrating than experiencing a system crash in the middle of an important task. Whether it’s a sudden blue screen, an endless reboot loop, or an application that forces the entire system to shut down, these disruptions create immediate productivity roadblocks.
System crashes and reboot issues often stem from software conflicts, outdated drivers, hardware failures, or insufficient system resources. Employees or customers encountering these issues typically submit urgent support tickets, as crashes can result in lost work, corrupted files, or even complete system failures that prevent them from accessing key applications.
Organizations can minimize these disruptions by enforcing proactive IT policies like regular system updates, driver management, and automated error logging to identify potential failures before they escalate. IT teams should also provide clear troubleshooting steps in self-service portals, helping users resolve minor crashes independently.
In cases where issues persist, remote diagnostic tools can allow IT support teams to assess and fix system problems more efficiently without requiring extensive back-and-forth communication.
13. User role and permission changes
Modern organizations rely on role-based access control to maintain security, streamline operations, and ensure that employees can access the tools and data they need—all while keeping sensitive information protected. But as companies scale and team structures evolve, help desks also see a spike in tickets related to user role and permission changes.
Requests like these might look like granting new employees access to necessary systems, modifying permissions as employees take on new roles, or revoking access for those who leave the company. Without a well-structured access management system, these tickets can create bottlenecks, delaying employees from completing critical tasks and increasing security risks due to misconfigured permissions.
IT teams can reduce these requests by implementing automated role-based provisioning, allowing permissions to be assigned dynamically based on predefined criteria. Self-service access request workflows can also empower employees to request changes through an approval process, reducing IT workload while maintaining security.
Organizations should stay vigilant by regularly auditing access logs and permissions to prevent unauthorized access and ensure compliance with security policies.
Tips for Overcoming Common Help Desk Issues
Most common help desk issues have simple resolutions, but the sheer number of these requests can bog down support teams. What can you start implementing today to deflect these support tickets?
Here are some actionable recommendations that will help you proactively overcome these common help desk challenges, enabling help desk teams to focus on more unique issues, improve time-to-resolution for tickets, and better manage support ticket queues:
1. Provide hands-on training for help desk agents with sandbox environments
Sandbox environments provide organizations with replicate versions of their applications for user testing and training. With a tool like Whatfix Mirror, you can easily create sandbox environments for your help desk and its support flows and tasks. Use this cloned application for interactive, hands-on user training in a risk-free software environment. This accelerates time to proficiency and prepares new agents for common flows and issues.

2. Provide self-help user support solutions
Unlike help desk tickets that require intervention from IT and customer support representatives, self-help user support channels like a service desk empower users with the resources they need to resolve support queries on their own time. This is one of the critical differences between help desks and service desks.
This autonomy is especially useful to reduce the volume of tickets submitted for simple user questions like how to request access or permissions to apps and services, manage password resets, avoid installation errors, and more.
Fewer support tickets mean less time and cost spent solving avoidable issues and more bandwidth for support teams to tackle complex product challenges and implementation projects.
What does self-help user support look like in action? Customer self-service support and internal employee self-support resources can include:
- FAQ pages, knowledge bases, and internal wikis
- Team centers and IT self-service portals
- Embedded self-help wikis that overlay your application’s UI and aggregate your knowledge repositories and documentation into one place
When the recruiting company, Reed, transitioned to a new CRM software, its service desk was bogged down by high volumes of assistance calls on simple “how to” questions. Reed used Whatfix’s digital adoption platform to create and implement self-help guides within the CRM, resulting in a 23% reduction in support calls per user in six months.
3. Proactively provide in-app guidance to avoid support issues
As we’ve already explored in the example above, in-app guidance works to reduce support tickets by creating more empowered, expert end-users with contextual experiences and self-help support.
Unlike external knowledge bases and training modules, in-app guidance centralizes software education and task execution within a single platform. Users aren’t pulled out of their workflow and don’t have to spend extra time jumping between systems or waiting for others to access information.
In-app guidance like tooltips, task lists, product tours, pop-ups, and interactive flows give users contextual knowledge of essential features and on-screen elements. Unlike sitting through a training course or watching a video tutorial, these interactive content formats give users instant access to knowledge in their time of need. No dependencies. No wasting time searching for answers from disparate sources.

4. Use product analytics to identify friction areas in your application’s UI
Submitting queries to a help desk is a reactive form of user support. Organizations today have the opportunity to drive user activation and retention with proactive customer engagement.
Instead of waiting for users to run into an issue and submit a help desk ticket, product teams can analyze user behavior to predict areas within the product where users might encounter friction or drop off a journey. Companies use Whatfix’s product analytics capabilities to capture how users move through their products – whether it’s a custom customer-facing application or internal enterprise software for employees like a CRM, HCM, or ERP.
By segmenting data into specific user groups and product flows, teams can build accurate conversion funnels, create personalized onboarding and training programs for different user cohorts, and deliver guidance before users even encounter an issue.
5. Make data-driven product and UX improvements
Common user friction points within software applications include:
- Log-in or sign-up flows
- Onboarding processes
- In-app search or navigation menus
- Form submissions
- Product updates or process changes
- New feature rollouts
- Third-party integrations and APIs
Beyond predicting customer support and internal IT-related queries, the data you collect from your user analysis can help you reimagine your product experience — ultimately the source of most support tickets. For example, low user conversion rates during onboarding may prompt you to deploy an in-app task list outlining your product’s key activation tasks.
But what if user conversions deteriorate after step two out of eight in your task list?
Now, you have data-backed proof to support a business case for shortening your entire onboarding flow and redesigning the user experience.
6. Standardize communication templates for agents
Consistency is key when it comes to help desk communication. Support agents handle a high volume of tickets daily, and without standardized responses, customers and employees may receive inconsistent information, leading to confusion, frustration, and longer resolution times.
Creating and maintaining a library of pre-written response templates ensures that agents provide clear, accurate, and professional responses to common inquiries. These templates should cover frequently asked questions, troubleshooting steps, escalation procedures, and closure confirmations while still allowing agents to personalize their messages based on the user’s specific issue.
Standardized communication also enhances efficiency—agents can respond to tickets faster without needing to type out the same explanations repeatedly. Integrating these templates into your ticketing system, chatbots, and email workflows allows for seamless automation while maintaining a human touch. Organizations can improve response accuracy and customer satisfaction by continuously updating and refining templates based on real-world ticket data.
7. Introduce predictive support models
Instead of waiting for users to submit help desk tickets, forward-thinking organizations leverage predictive support models to anticipate issues before they escalate. By analyzing historical ticket data, user behavior, and system performance metrics, IT teams can proactively address potential problems—reducing downtime and improving user experience.
For example, machine learning algorithms can identify patterns in common support issues, such as recurring software crashes or frequent password resets, and trigger preemptive actions like automated fixes, early alerts, or proactive knowledge base recommendations. Similarly, monitoring system health can help IT teams detect performance degradation, allowing them to resolve issues before they impact end users.
Predictive support doesn’t just reduce ticket volumes—it also enhances user trust and confidence in IT services. When employees or customers experience fewer disruptions, they spend less time troubleshooting and more time focusing on their tasks, leading to higher satisfaction and productivity.
8. Provide video-based solutions for complex issues
Some help desk issues are too intricate to resolve through written instructions alone. When users struggle to follow step-by-step guides or misunderstand troubleshooting procedures, support tickets can drag on unnecessarily—resulting in frustration on both sides. Video-based solutions offer a more effective way to communicate resolutions for complex technical problems.
Short, concise instructional videos demonstrating troubleshooting steps, configuration settings, or best practices help users quickly grasp solutions without needing live assistance. Screen recordings, narrated walkthroughs, and interactive tutorials can visually guide users through difficult processes, reducing the need for back-and-forth explanations.
Embedding these videos directly into self-service portals, knowledge bases, and in-app support widgets allows users to access help at their exact moment of need. AI-powered video search capabilities can also help users find relevant clips based on keywords, making it easier to locate the right guidance without submitting a ticket. Organizations that integrate video-based support see reduced resolution times, fewer escalations, and improved overall help desk efficiency.
Help Desks Click Better With Whatfix
Gone are the days when efficient automated support systems required complex installation cycles and heavy development work.
Whatfix empowers businesses with the tools they need to be proactive, intentional, and data-driven in customer support and education. With Whatfix Self Help, organizations can embed an intelligent self-service layer directly into their applications, surfacing relevant help content and guiding users through troubleshooting without ever leaving their workflow. This deflects repetitive tickets, reduces resolution times, and enables users to solve issues independently.
For onboarding and training new agents, Whatfix Mirror creates sandboxed environments that replicate real applications, allowing agents to practice handling tickets, navigating software, and resolving common help desk queries in a risk-free space. This accelerates proficiency and ensures agents are well-prepared to support end-users from day one.
Enhance your in-app experience with interactive content, product tips, and product flows that provide step-by-step assistance for commonly asked questions and unfamiliar features. By integrating Whatfix Analytics, IT and support teams gain deeper insights into where users struggle, allowing them to refine support resources, optimize UX, and preemptively address friction points before they turn into escalated tickets.
Take control of user satisfaction and digital proficiency with Whatfix to encourage independent troubleshooting for straightforward queries, freeing up your team’s bandwidth for strategic problem-solving that builds long-term partnerships.
See how Whatfix can streamline your help desk operations and reduce ticket volumes—request a demo today.