The average organization spends anywhere from $7.9M (firms with <500 employees) to as high as $224.8M on SaaS subscriptions annually (mostly enterprises with >10k employees).
Despite that heavy cost, the average company uses just 56% of their active SaaS licenses. The other half is either an impulse purchase that gets used once only, or turns to shelfware because the target audience doesn’t know their organization has licenses available. All told, that 44% of unused subscriptions translates to somewhere between $3.476M to $98.9M wasted. Every single year.
You can’t fix that waste without measuring and tracking—in detail—how much your end-users interact with and correctly your software and application investments.
Beyond license usage, application owners and IT managers must also track end-user behavior to analyze how employees use enterprise software and complete the tasks they’re responsible for. Creating frictionless workflows decreases time-to-completion rates, driving business outcomes.
In this article, we explore how application owners can track and measure software usage to drive ROI from their enterprise software and digital transformation investments.
What Is Application Usage Tracking?
Application usage tracking captures how employees interact with enterprise software. By measuring time-to-completion for core tasks, identifying underused features, and spotting friction points, IT leaders gain data to optimize processes and drive adoption.
Without usage insights, organizations can’t improve process KPIs, maximize productivity, or ensure digital transformation success. This puts critical initiatives at risk and creates costly inefficiencies. With the right usage tracking and digital adoption solution, enterprises can connect insights to action—delivering targeted in-app guidance, tailored training, and measurable ROI.
Types of Software Usage Tracking & End-User Monitoring
While the general concept is the same, your approach to end-user monitoring will be slightly different, depending on whether you’re trying to track and improve the UX of your customers, employees, or partner. The audience you’re trying to monitor’s usage determines your approach and the tools that’ll best suit your use case.
1. Application performance monitoring
Application performance monitoring (APM) refers to both the tactics and tools used to monitor and manage the performance and availability of software applications. It involves tracking various metrics related to an application’s performance, such as response times, resource usage, error rates, and overall user experience. APM aims to identify and resolve issues that could affect an application’s performance and ultimately impact user satisfaction.
APM tools collect data from different layers of an application’s infrastructure, including servers, databases, networks, and end-user devices. By analyzing this data, APM or observability solutions provide insights into the application’s behavior and performance bottlenecks. These insights help proactively detect and diagnose issues, optimize application performance, and ensure that applications meet performance expectations.
Types of application performance issues you can monitor include:
- Outages
- Slow page load times
- Product bugs
2. Business activity monitoring
Business activity monitoring (BAM) refers to the process of tracking key business processes in real time to gain insights into an organization’s overall performance and health. It involves collecting, analyzing, and presenting data related to various business activities, which then empowers stakeholders to make informed decisions promptly.
BAM integrates data from multiple sources within an organization, such as enterprise applications, databases, sensors, and more, to provide a comprehensive view of ongoing activities. By monitoring these activities in real time or near real time, BAM helps detect bottlenecks and inefficiencies. This, in turn, allows companies to react swiftly, address issues before they escalate, and optimize processes for better performance and productivity.
Types of business activity analytics you can monitor include:
- Process governance
- Compliance monitoring
- Process completion rates
3. End-user behavior monitoring
End-user behavior monitoring focuses on observing users’ engagement patterns with your digital properties (i.e., websites, applications, etc.). The goal is to find trends in their behavior that suggest how you might improve user experience, eliminate friction in user flows, or any issues that might negatively impact completion rates or process efficiency.
To better isolate issues or data points, end-user monitoring typically combines multiple channels: for instance, let’s say you observe that 92% of the prospects on your homepage exit within <20 seconds. Regardless of your industry, acquisition channel, etc., that’s a high churn rate.
So, you might want to observe what users encounter when they navigate to that landing page by watching several session replays, conducting some funnel analysis (i.e., how many of the 8% that don’t churn continue to checkout?), observing the heatmaps for the homepage to see where interactions are clustered, etc.
Combining these channels will help you cancel false positives and suspicions to discover the problem. Maybe it could be that your homepage often goes blank after loading. In that case, you’ll need to fix that and test again.
In other words, monitoring end-user behavior helps you improve your product experience. It also helps you personalize your website or product to suit users’ expectations.
Types of end-user behavior variables or metrics you can monitor include:
- User experience journey mapping
- Funnel analysis to identify user friction and areas of dropoff.
- Conducting a cohort analysis to compare groups of users.
- Time-to-adoption, time-to-completion, and related user adoption metrics
Software Usage Tracking vs. Software Metering
Given the similarities between metering and usage tracking, it’s easy to mistake one for the other. For one, both methods track software users engagement, monitor end-user behavior, and organize them by when the data was accessed, how long it was used, and by whom; similarly, both tactics/approaches help ITSM teams optimize their organizations’ software usage by identifying and reducing SaaS waste.
But, when you zoom in, there are subtle differences in both their methods and goals: for instance, software metering simply tracks how many times an application is launched or left running, while usage tracking monitors how users interact with a software tool, the features they engage with, how they navigate UX patterns/UI elements, and the issues they run into.
It’s similar to the difference between web and product analytics: tools like Google Analytics, Plausible, Matomo, and Fathom are designed to help site managers track page visits, unique visitors, bounce rate, sessions duration, etc., while product analytics platforms like Whatfix Product Analytics, Heap, Amplitude, and Mixpanel capture feature usage, adoption rates, user flows (i.e., which paths do users take as they navigate through the product), retention rates, and user sentiment metrics such as churn, satisfaction, Net Promoter Score (NPS), and Customer Satisfaction Score (CSAT).
While there’s an overlap, the first (i.e., Web analytics) is used to capture general interest and interaction with prospects, while product analytics comes into play when you’ve converted some of those prospects into users.
How to Monitor Software Usage at Your Organization
First, you need the technology, specifically the right combination of product analytics and ITSM tools, to monitor user interactions with internal applications, enforce company policies, and automate routine workflows like onboarding, offboarding, and incense renewals. Next, you’ll need detailed management policies for adopting and offboarding software tools.
1. Use product analytics to capture end-user behavior
As we explained above (i.e., under usage tracking vs. software metering), product analytics enables your ITSM team to closely observe how users interact with your internal stack, including their interactions with UX patterns and UI elements, browsing patterns, navigation behavior, and any issues they face.
First, you’ll need to integrate the product analytics platform’s tracking code or SDK into your internal applications and then define specific events to be tracked, such as logging in and accessing specific features.
Once that’s in place, product analytics tools enable you to segment users based on the various criteria it tracks, such as demographics, usage patterns, subscription plans, or user roles within the software application. Using these data points as a benchmark, you can track each user’s journey through specific workflows, and measure user activation (i.e., whether your end-users try out the tools at all), churn (i.e., how many are still using it after X weeks of months), and retention to understand how your employees’ disposition to specific tools in your stack.
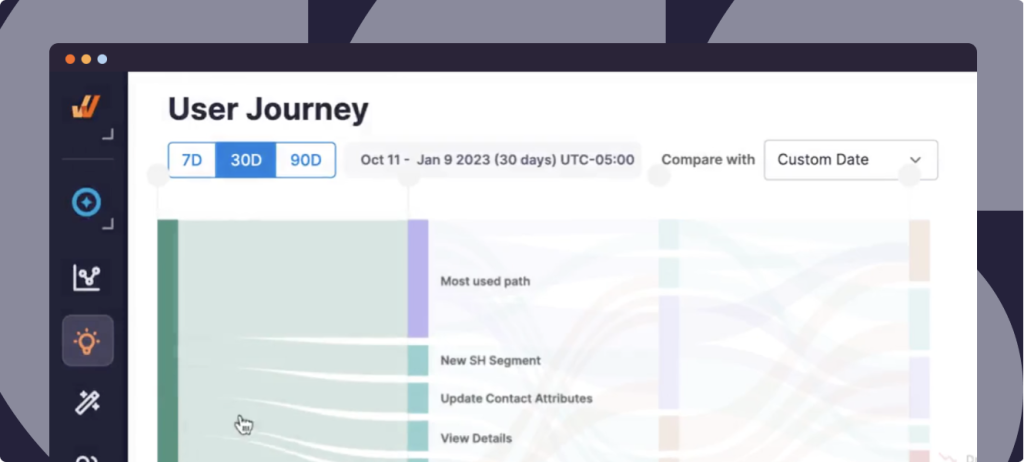
Then, using a product analytics platform like Whatfix Product Analytics, you can track custom user events like pageviews, clicks, form fills, process completions, etc. This allows you to see average completion rate for your business processes, identify dropoff areas and adoption rates, both for a product and its individual features.
2. Use a SaaS management platform
A SaaS management platform is essentially a dashboard where you can administer and optimize your organization’s SaaS applications from a single source of truth. That is, once your SaaS tools are connected, you can grant or restrict specific users’ access, automate workflows for provisioning, onboarding, and offboarding users, manage the entire lifecycle of SaaS subscriptions, from procurement and provisioning to renewal and decommissioning, and enforce security policies and compliance requirements for SaaS applications.
It grants you unlimited control over and visibility into each product’s usage, costs, security, and compliance profile. Specifically, an ITSM platform tracks usage patterns for each product in your stack, and informs you on how many licenses are being actively used, so you can decide which ones to renew or decommission.
3. Create a process to vet and onboarding new software
How do you even decide which applications your organization needs? If you adopt a decentralized model where any staff can pay for Figma, Trello, or just any new SaaS that catches their fancy, you’ll end up with hundreds (possibly, thousands) of unused licenses, costing you hundreds of thousands of dollars annually.
This, among several other reasons, is why you need to gatekeep new subscriptions intentionally: given the variety in the software landscape, there’s a lot of opportunity for duplicate licenses to multiply, or for employees to purchase new SaaS products when licenses for close substitutes already exist (e.g., signing up for ClickUp when everyone gets a Notion license by default) even when you already have a solution that solves the problem you’re facing quite comfortably.
Consequently, you need well-thought-out policies for shortlisting potential software purchases, vetting them to ensure they meet your needs and are not duplicates, and then creating onboarding programs to simplify your end-users’ learning curve.
How to Track End-User Application Usage With Whatfix
Whatfix is an all-in-one product experience and analysis platform that’s designed to help ITSM teams:
- Understand how their end-users interact with their software stack.
- Create in-app guidance and self-help resources to maximize employees’ productivity powered by your software investments.
- Identify areas of user frictionand continuously improve your business processes and workflows.
To help you achieve that, Whatfix offers a product analytics suite and a digital adoption platform to create in-app guidance and support experiences.
Whatfix Product Analytics enables CIOs and application owners to identify and observe user interactions within your third-party applications.
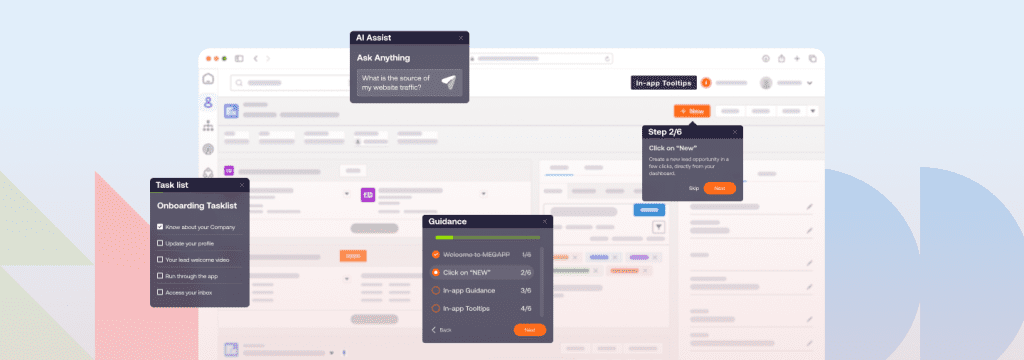
Whatfix DAP functionality helps you insert contextual guidance aids such as UX hotpots, UI tooltips, personalized onboarding, guided tours, and step-by-step walkthroughs into the product experience, especially at any hotspots where your analysis shows users are facing friction.
Here’s a brief on how they work.
1. Identify and set up custom user events to track
Actions such as signing up, logging in, completing a form, clicking on specific buttons, navigating to particular pages, or even hovering over UI elements can be used as a proxy to determine if, and how much your end-users interact with applications in your tech stack.
For each of these user actions, you need to define the relevant parameters that you want to track, which could include user ID, timestamp, event type, action performed, object ID (if applicable), and any additional contextual information that would signal the action is taking place, when, and how.
You can set up these custom events inside Whatfix, generate and integrate an event tracking code in the application whose usage you’re tracking, and test various scenarios (in a sandbox) to ensure it’s working as expected.
Then, using the insights gathered from event tracking you can better understand user behavior, identify usage patterns, and pinpoint areas for improvement in the user experience.
2. Monitor and benchmark your end-user usage data
Once you’ve set up the custom events you intend to track (user activity, session duration, feature adoption, login frequency) next, you’ll need to feed the data you collect from step (1). above into your analytics tools. To make sense of that data, you must define a set of standardized metrics and key performance indicators (KPIs) to measure and benchmark usage, based on historical data. That is, you’ll want to measure these usage data points over time, average them out and use that as your benchmark.
Going forward, ensure you regularly monitor your end-user usage data for each application in your stack and compare it against your benchmarks and targets. If possible, use data visualization tools and dashboards to track usage trends, identify deviations from expected performance, and pinpoint areas that require attention or optimization.
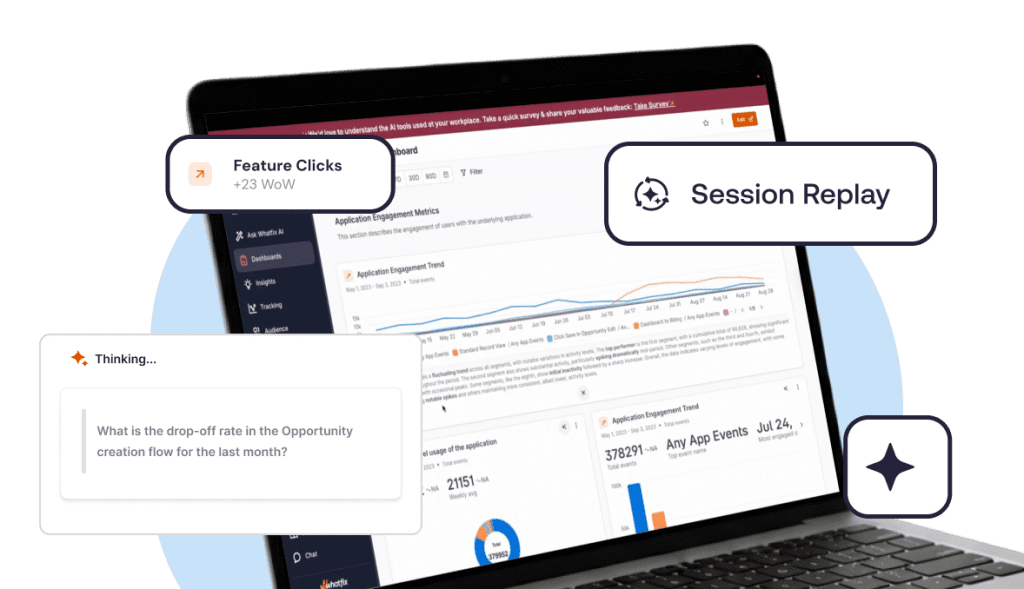
With Whatfix, application owners don’t need prior product analytics experience to extract end-user trends and insights from the platform. Simply use Whatfix AI’s conversational interface to ask application-related questions and gain visibility into user trends.

3. Create targeted strategies to drive adoption among those least using your applications
First, you need to assess this situation from a user’s perspective: are they (i.e., your target employee persona) aware that this application is available? If so, does it solve their problem? Does it sync well with the rest of their work stack, and does it have the training and support ecosystem they need to get confident using the application?
Asking these questions will help you determine if an application needs to be decommissioned, if you need to invest in training and guidance resources, build integrations with the rest of your stack, or just inform your end-users about the tool and its capabilities.

4. Analyze for areas of friction
Product session replays help you look over your users’ shoulders to understand how they interact with your stack. That way, you can see exactly what they experienced while browsing and using an application. Other features can help you infer when something’s going wrong, ask the right questions, and gradually isolate what’s the issue – like:
- Cohort analysis i.e., Why do 80% of the users who get to this stage drop off before the next?
- Heatmaps (i.e., Why do users press this button repeatedly? Is it dead or frozen
- In-app user surveysi.e., Straight up ask users where they’re facing issues.
- Form analytics: Identify fields with high abandonment rates, errors in form submissions, or areas where users hesitate or struggle to complete the form.
- Error tracking: Monitor and track errors encountered by users while using the app; identify common error messages, error rates, and the specific actions or screens where errors occur to address technical issues and usability challenges.
- Session Replay with Console Logs: Combine session replay with console logs to capture user interactions alongside error messages or console errors encountered during the session.

5. Use user-behavior data to influence new in-app content creation
Using all the data you’ve collected so far, you can paint an accurate picture of where your users are facing friction within your third-party applications. You can turn their feedback into self-paced tours, step-by-step walkthroughs, UI tooltips (wait! Do this!), alerts, and notifications that trigger strategically when users perform certain actions, interact with specific UI elements, etc.

Software Clicks Better With Whatfix
With Whatfix, enable your workforce to drive maximum value from your software investments, improving their productivity and powering business outcomes. With Whatfix, you can:
- Analyze any custom user event without technical expertise to track end-user engagement and identify workflow friction.
- Create in-app guided experiences to onboard new employees, provide additional end-user training, and support them during application migrations or change projects with Tours and Task Lists to improve their time-to-productivity.
- Enable end-users with Self Help, an in-app resource center that integrates with your knowledge repositories, SOPs, and training content.
- Use Flows and Smart Tips to provide contextual assistance on complex processes and infrequently done tasks, or to overcome areas of friction.
- Communicate any company news, upcoming change, process updates, new training, or any company-related information with in-app Pop Ups.
- Collect end-user feedback with Surveys
- Quickly create sandbox IT environments for hands-on user training with Whatfix Mirror.
Ready to learn more? Request a Whatfix demo now!
