The phrase “learning curve” has become a common colloquial phrase to describe how a skill isn’t easily acquired. Typically, most learners experience a learning curve at the beginning of a new experience, and that incline tapers off as they gradually learn more about the subject matter.
However, it’s more than just a common phrase. The learning curve theory is a well-known concept still used today by learning and development teams to drive knowledge retention and skill development. The learning curve mathematical formula provides organizations with a measurable way to understand how long it takes to acquire a skill or master a task. It may also be described as the ‘experience curve’, ‘cost curve’, ‘efficiency curve’, or ‘productivity curve’.
In this article, we’ll explore the Learning Curve Theory, its history, advantages and disadvantages, types of learning curves, how to calculate it, and its application for modern learning and development strategies.
What Is a Learning Curve?
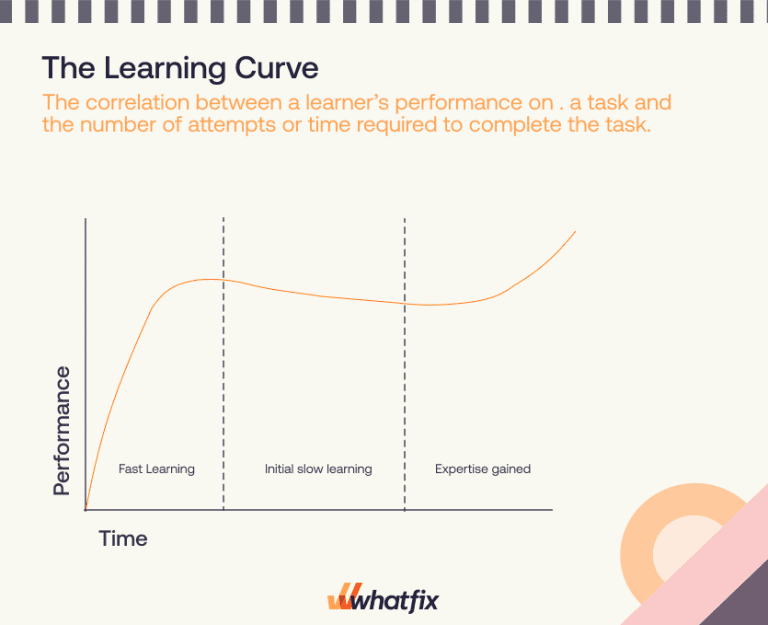
The learning curve is the correlation between a learner’s performance on a task or activity and the number of attempts or time required to complete the activity.
Generalized vs. Measured Learning Curve
The learning curve has both a general definition and a defined quantitative application.
- Generalized: The generalized learning curve is a common phrase that describes the time it takes to learn a challenging task or skill. It can be a generalization, such as learning how to ride a bike or become good at a specific video game, and is a qualitative description of how long it takes to learn a skill.
- Measured: Measured learning curves are defined, and a mathematical formula calculates proficiency or expertise in a task. Skills must be repeatable and measurable to quantify, and one can only examine one variable in a skill, task, or process.
History of the Learning Curve Theory
The idea of the learning curve theory has been dated back to the 1880s and has evolved through the decades. Here is a brief overview of the learning curve model’s history:
Ebbinghaus Forgetting Curve
The idea of a learning curve was first proposed by Dr. Hermann Ebbinghaus in 1885 when developing his forgetting curve theory. His theory was designed to understand how people retain and lose information. It helps organizations understand when and why we lose information and how we can fight this knowledge loss.
General Experimental Psychology
Fast-forward to 1934, Arthur Bills explores the idea of a learning curve in his paper General Experimental Psychology, describing it as a graphical representation of understanding efficiency improvement rates on a given task or practice. Bills presented two types of learning curve graphs: one that represented an increase in productivity as time progressed and the second a declining curve showing the time needed to perform a task.
Wright’s Experience Curve
In 1936, T.P. Wright developed the basis for the modern learning curve formula, which he termed the “Cumulative Average Model” (also known as “Wright’s Model”) in his paper Factors Affecting the Cost of Airplanes. Wright noted that the cost of building airplanes decreased as production performance and efficiency increased. While many variations of the learning curve model exist today, this is the original formula’s foundation.
Modern application for employee L&D
The learning curve theory is based on the concept that there is an initial period where the amount invested in learners is more significant than the return. However, after overcoming the learning curve, the return is much greater than the investment.
The idea here is that the more an employee practices a task, the better they become at it, which translates to a lower cost of training and higher output over time. The learning curve model helps track training progress, improve productivity, and predict learners’ performance and improvement over time.
What’s the Learning Curve Formula?
The original learning curve theory formula is: Y = aX^b
- Y = The total average time to perform the task per unit or batch
- a = Time taken to perform task initially
- X = The total units of production or times task completed.
- b = Represents the learning curve function slope
The learning curve is the correlation between a learner’s performance on a task or activity and the number of attempts or time required to complete the activity.
The overall theory of the learning curve formula says that as the number of times a person attempts a task increases, the overall amount of time to complete the task will decrease. The learning curve formula can then predict how a person can learn a task.
However, the relationship between the time spent practicing an activity and overall performance is not linear. There will always be specific periods for each activity where a small amount of practice would yield massive output improvement, or even minor improvements may require many work hours. This variance in the relationship between training and proficiency over time is known as the ‘learning curve.’
Types of Learning Curve
Depending on the task or process, there are four types of learning curve progression models.
1. Diminishing-returns learning curve
In the diminishing-returns learning curve, the rate of progression increases rapidly at the start of learning and decreases over time. This can describe tasks that are easy to learn and rapidly progressing skills. Activities that follow a diminishing returns learning curve are more straightforward when measuring and predicting how the workforce’s performance and output will change over time.
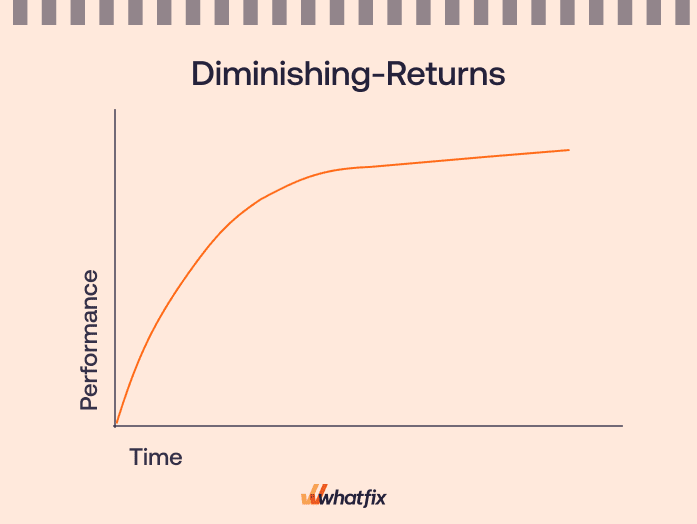
Once a learner obtains full proficiency in a task, the progression levels off (called a plateau), and the learner no longer improves his time-to-completion rates. This is either due to maximizing task efficiency or fatigue having set in.
2. Increasing-returns learning curve
In the increasing-returns curve, the rate of progression is slow at the start and rises over time until full proficiency is achieved. This describes tasks that are difficult to pick up and have slow skill acquisition rates.
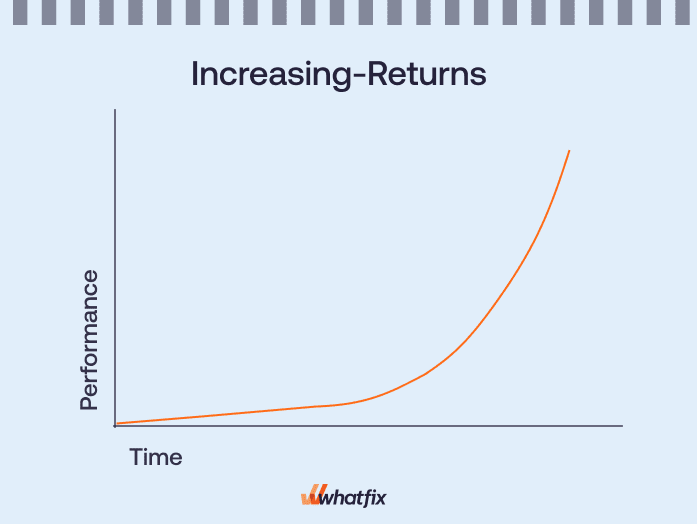
No action items are required here in terms of decision-making, as the initial cost of slow learning is quickly returned upon reaching the high-efficiency phase. However, if the rest of the data shows that the task should not take very long for employees to learn, this graph indicates that you should modify your employee training methods.
3. S-curve
The “S” curve model, also known as the increasing-decreasing return learning curve model, is the most commonly cited type of learning curve model. It represents learners entirely new to a task.
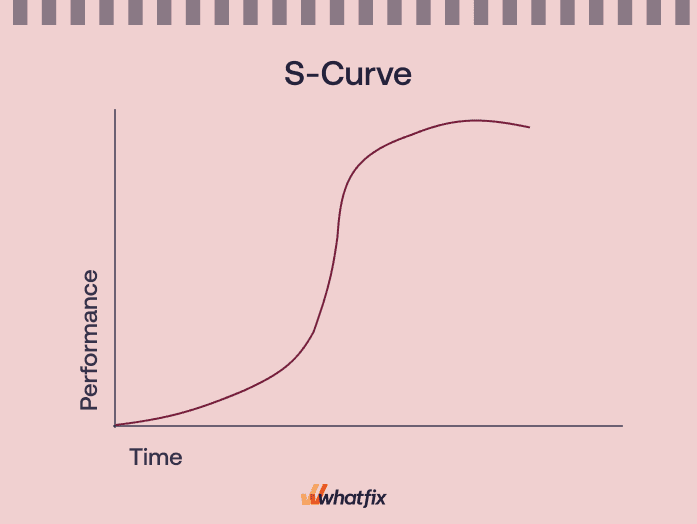
The bottom of the curve represents how learners are slow to perform a new task initially and have slow improvement progression. However, as learners complete a task over time, they take less and less time to complete it and experience a rapid improvement in proficiency until the skill is acquired, at which point performance (and the learning curve) flatten. This represents an overall plateau that has been reached in terms of maximum task efficiency or a new challenge has emerged acting as a barrier to improvement.
4. Complex curve
The complex learning curve is designed to model and map more complicated learning patterns on the way to task mastery and requires more detailed progression tracking. This suggests that the measured task is challenging to learn and takes a certain amount of practice before a learner can become proficient.
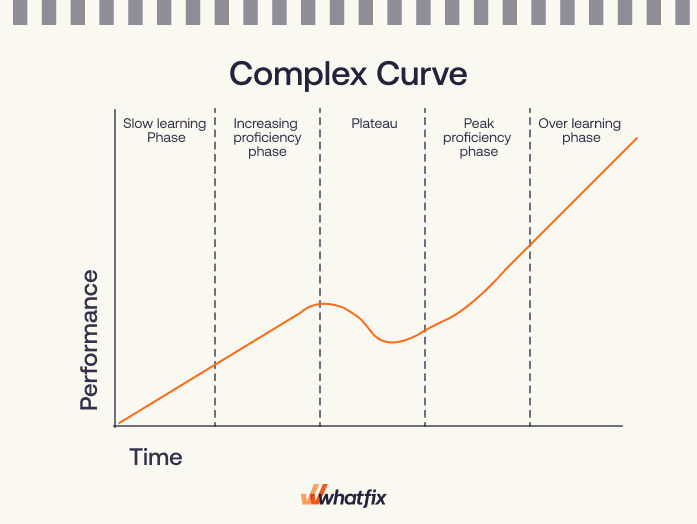
The five stages of the complex learning curve are:
- Stage 1 – indicates a slower initial learning phase.
- Stage 2 – shows a productivity increase, indicating that the learner is becoming more proficient.
- Stage 3 – indicates that the learner is plateauing in their proficiency once they have reached a certain mastery of the skill.
- Stage 4 – represents that the learner realizes there is still room for improving the skill and performance again increases.
- Stage 5 – this stage is also known as “overlearning”, where a skill becomes automatic, muscle memory for the learner.
The complex learning curve model looks different for each activity, individual, or group. When learning tasks with complex learning curves, learners often encounter multiple peaks and plateaus.
Advantages and Disadvantages of the Learning Curve
The learning curve model helps monitor various aspects of company performance and identify areas that need improvement. It provides insights into employee training and performance, but limitations do exist with the learning curve model.
Let‘s examine some key advantages and disadvantages of the learning curve model.
Pros of the learning curve model
- Cost reduction as efficiency increases: As employees or processes become more experienced and efficient, the time taken to complete tasks often decreases, reducing labor costs. Furthermore, with experience, there’s a better understanding of optimizing resource usage and minimizing waste, contributing to lower production costs.
- Improved output quality: With increased experience, workers better understand their tasks and processes. This enhanced knowledge and skill lead to a decrease in errors and defects, resulting in higher quality products or services. The learning curve allows for refining techniques and processes, enhancing overall quality.
- Skill development: The learning curve model emphasizes continuous improvement and a culture of learning. As workers become more skilled, they become more valuable assets to their organization. This model also supports the idea of ongoing training and skill development, ensuring that employees are always up-to-date with the latest techniques and technologies in their field.
- Predictable performance metrics: The learning curve model helps establish predictable performance improvement patterns and allows L&D leaders to measure training effectiveness over time. This predictability is valuable for planning and forecasting. Organizations can use historical data to predict how long it will take for new employees to become proficient or to implement new processes fully and efficiently.
- Risk mitigation: With experience, organizations learn to identify and avoid potential risks and pitfalls. The learning curve allows them to develop strategies and contingency plans based on past experiences. This knowledge helps mitigate risks associated with new projects or introducing new processes, as the organization becomes more adept at foreseeing and managing potential issues.
Cons of the learning curve model
- Limited application: The learning curve model is most effective in environments where tasks are repetitive and consistent over time. In industries or job roles where tasks are highly variable or require significant creative or adaptive work, the benefits of the learning curve may be less pronounced. For instance, in artistic or research-based fields, efficiency, and productivity improvement over time may apply less than in manufacturing or routine service tasks.
- Doesn’t account for multiple variables: Using the learning curve model to predict performance and skill acquisition for larger groups (like in large workforces) means that assumptions are made about variables like learner motivation, sociological factors, workplace dynamics, L&D resources, and previous subject matter knowledge or task experience.
- Additional analysis might be required: If a learning curve model fails to show the expected results (ie. task improvement over time), additional analysis would be required to identify and isolate other variables impacting learning outcomes.
Examples of the Learning Curve Theory in the Workplace
L&D teams can use the learning curve model to determine the time needed for a person (or group of people) to master a new skill or process. In many workplace applications of the learning curve model, the actual learning is the process improvement.
1. Project management
With project management, teams become more proficient by processing repeated tasks or similar projects. Initially, a project may take longer and involve more resources due to unfamiliarity or unanticipated challenges. However, as the team gains experience, they develop more efficient processes, problem-solving skills, and a deeper understanding of the project requirements. This leads to reduced time and cost in subsequent projects.
2. Manufacturing
The learning curve can track its workforce’s performance with its manufacturing costs by replacing “performance” and “number of attempts” with total production in units or cost per unit. As time progresses, workers will produce more, and the “per-unit” cost will decrease.
Organizations can predict this reduction in per-unit cost by modeling the change with the learning curve. This is done by considering labor costs and employee training and will impact the cost of a good or service. Initially, the product may reach the market at a higher price point because of the high per-unit cost to produce a good. Over time, this will decrease as the workforce’s efficiency increases.
3. Employee training
When onboarding and training new employees, L&D teams are tasked with accelerating the time-to-productivity for new hires. With the learning curve model, organizations can measure the amount of time different tasks and processes take to master, allowing business operations teams to forecast company growth better and enable employees to succeed in new roles.
4. Technology adoption
Introducing new technology in an organization typically involves multiple learning curves. Let’s look at technology adoption from an enterprise perspective, specifically implementing a new technology like a CRM or ERP.
Initially, employees may struggle using the new systems and incorrectly use the software’s workflows, reducing productivity and potentially leading to internal resistance to change. With enterprise software being highly complex and custom-built for business requirements, employees start from square one. Their only experience may be with similar tools and tasks, but not with the ones they’re now learning. It presents a significant barrier to change management that involves overcoming a complex learning curve.
Over time, as they become more familiar with the technology, their proficiency improves, leading to increased productivity, innovation, and often a competitive advantage. This occurs when organizations achieve digital adoption, where employees (or application end-users) efficiently complete tasks, enabling organizations to achieve the intended business outcomes of a technology implementation and maximize their digital transformation ROI.
CASE STUDY: How REG reduced time-to-proficiency of its CRM and ERP by 50%
REG’s L&D and IT team faced challenges training employees to its highly customized Salesforce CRM and JD Edwards ERP instances. New employees took upwards of six months to become proficient with the system, leading to frequent account errors and incorrect process usage. Existing users were failing to adapt to new processes and adopt new features.
Whatfix enabled REG to standardize its end-user training via contextual in-app guidance in the flow of work. With Whatfix, REG reduced its time-to-proficiency for its CRM and ERP by 50%, equally a 3-month faster onboarding time for new employees. It also reduced daily IT support tickets by 600% by deflecting issues with in-app support.

5. Healthcare and medicine
In healthcare, the learning curve can be applied to various aspects, such as surgical procedures, diagnosis methods, and patient care techniques.
For instance, surgeons may take longer to perform a particular procedure initially, but their speed and efficiency improve as they repeat it, often leading to better patient outcomes. Similarly, healthcare professionals become more adept at using new medical technologies or treatment protocols with experience.
The learning curve is also accelerated as surgeons and other healthcare leaders master procedures and skills, allowing them to take a “train-the-trainer” approach to their instructors to help identify new resources to create, learning methods to use, types of assistance required, and identify friction points in the process.
How to Accelerate the Learning Curve
L&D teams and educational instructors can accelerate the learning curve with the right approach and application. Here are eight best practices to help flatten the learning curve:
1. Define your unit of output
Set long and short-term measurable outcomes to evaluate employee performance, training effectiveness, and task mastery. Make the purpose of your training program clear by identifying what employees are expected to accomplish by the end of training.
2. Efficient onboarding
To help a new hire acquire competence and remain confident in their role, be sure to create an efficient onboarding process. A strong onboarding process provides newly hired team members with the right information, training, and tools during their first few weeks at a company, making their learning curve more productive and much shorter in the future.
3. Personalized training
Create personalized learning programs with training content tailored according to individual job roles and learning types. Personalized learning drives employee engagement, improves training effectiveness, accelerates time-to-proficiency, and accelerates the learning curve.
4. Make informed decisions
If the data from the learning curve shows that the current training process is not working, explore alternative employee training methods and implement other modifications to fine-tune your training programs. It might take a few rounds of trial and error to find the right change that improves performance.
5. Mentor coaching
Often no matter how well a formal employee training program is structured, it does not impart all of the knowledge and information employees need to perform their roles effectively. This is when real-life coaching from an experienced professional – a supervisor, mentor, or veteran employee – can be effective to acquire knowledge in real-time.
6. Invest in training technology
More organizations are leveraging employee training software to implement effective training with personalized learning content that uses user analytics to help shorten the learning curve across employees.
There are a few different types of employee training software that can be leveraged for creating and managing employee training programs.
- Corporate LMS – Corporate LMS tools help L&D teams identify and assess both individual and organizational learning goals, build learning content, track progress towards meeting those goals, and collect data for supervising and improving the learning process.
- Digital Adoption Platform – A digital adoption platform (DAP) integrates with existing digital tools to provide automated, personalized training – in the flow of work. DAPs assign each learner a contextual task list containing interactive walkthroughs and other in-app content based on a learner’s profile. Walkthroughs are step-by-step prompts that guide users through specific tasks or processes. Employees are supported as they complete tasks, driving skill acquisition and improving time-to-proficiency.
- Microlearning Platforms: Microlearning software provides bite-sized learning experiences for employees. This enables employees to learn in small chunks and better integrate training into their daily workflows.
7. Establish time frame
To shorten the learning curve, you must establish a time frame for achieving the set of desired outcomes to understand whether or not your training methods are providing the expected results. For example, new hires should be able to create and manage leads and accounts on a company’s CRM platform after completing a 3-week CRM training program.
8. Continuous monitoring
The learning curve theory shouldn’t only be applied during times of change or when training difficulties arise; instead, monitor the learning curve year-round. Continuous monitoring uncovers problems as soon as they appear, allowing you to easily correct and modify your approach as required.
Learning Clicks Better With Whatfix
With a digital adoption platform (DAP) like Whatfix DAP, organizations enable employees to overcome steep learning curves that come with complex software applications and digital processes through role-based in-app guidance and real-time support.

With a digital adoption platform (DAP) like Whatfix DAP, organizations enable employees to overcome steep learning curves that come with complex software applications and digital processes through role-based in-app guidance and real-time support.
With a DAP, organizations can enable their employees with:
- Sandbox application environments to provide simulated, hands-on training without risking live software usage with Whatfix Mirror.
- In-app guided Flows that walk employees step-by-step through complex workflows, new processes, and infrequently done tasks.
- Onboarding Tours and Task Lists that enable employees to reduce their time-to-proficiency on essential tasks and software.
- Contextual Smart Tips that provide additional information and nudges end-users to take specific action.
- Pop-Ups and Beacons that alert end-users to new updates, process changes, new features, or team announcements.
- Field Validation that ensure data is entered correctly, in the right format.
- Self Help that provides real-time performance support for employees right inside their applications.
- Guidance Analytics that track how employees engage, consume, and use in-app guidance and support. Understand who is completing in-app Task Lists, the impact Smart Tips are having on core metrics like time-to-completion, and what the most searched Self Help queries are.
Ready to get started? Request a Whatfix demo now!