If your product team is assuming or guessing what your customers and users want, you’re setting your product up for failure. Although we might think we know our customers well, we need to root our decisions in data — not assumptions.
If you interviewed the teams that built the best products, in any industry, you’ll start to see a trend. They used behavior analytics to make data-backed product decisions.
User behavioral data is a type of product analytics that enables product teams to understand your users and how they’re using a your product or service. Behavioral analytics captures engagement data on how users use, interact, and adopt your product, its flows, and its features.
In this article, we’ll define behavior analytics, explore how they should be used, and provide tips on how you can get started.
What Is User Behavior Analytics?
User behavior analytics track how end-users, customers, or visitors engage with and use a product, service, or website. User behavioral analytics enables product managers to track, measure, and analyze your product usage, map your journeys and user flows, identify friction areas, build user cohorts, track event conversions, and more.
Behavior analytics paint a clear picture and provides data into the gaps that traditional app analytics may not answer. For example, typical analytics might be able to tell you how many visitors a specific page gets in a day or week and how much time they spend on the page, but it can’t tell you what action a visitor is taking or where they raged quit an application — but behavior analytics can.
With behavioral analytics, product teams are able to take these insights to make data-driven decisions and create a useful product and intuitive user experience which ultimately drives product adoption.
Behavior analytics is typically separated into two groups: “user properties” and “event properties.”
What are user properties?
User properties are unique traits specific to each individual user. User properties include attributes such as:
- Unique or non-unique
- Active or non-active
- New or not new
Additional user property examples include how active they are, the size of their company, or how much data they’re storing in your platform.
User properties don’t change based on the user’s interactions with your website or app and will stay consistent even as events or behaviors change.
This user-level data empowers product teams with the ability to understand things such as:
- Where are users clicking?
- Where are users encountering friction points?
- Are users adopting new features?
- Is our onboarding experience and flow working?
- How long does it take users to convert?
- How effective are various in-app messages?
- How can we push users into various flows?
What are event properties?
Event properties are the actions a visitor or user takes when engaging with your platform or website. Common user events to track include engagement and usage events such such as:
- Making a purchase
- Inputting data in a field
- Interacting with a feature
- Identifying the sequence of events that led a user to a specific action
Again, the specific event properties you track will depend on your unique website or app. Event properties will be the same for each user.
User Actions to Track with Behavior Analytics
Here are seven specific actions to track with behavior analytics.
1. Clicks
When users click on an image, text, or another page area, they often expect to be brought to a new page or for a function to run. But sometimes, pieces of a website or app that users assume should be a link (such as images or logos) don’t lead anywhere — something that can be incredibly frustrating to users trying to find more information.
Tracking clicks can help you understand user behavior and what visitors expect. You can refine and edit your website to match their expectations and improve user experience.
2. Page scrolling
Scroll behavior tells how far down a user views your page before either clicking a link to a new page or leaving the website or app. Knowing where users are likely to stop scrolling can help you ensure all your most important information is easily visible and accessible.
3. Mouse movements
Mouse movements follow a user’s cursor as it moves around the screen. It can give you an idea of where the user is paying attention to and what information they find most appealing.
While mouse movements can be insightful, they often lack contextual information. When paired with other user engagement metrics, you’ll benefit most from this kind of behavioral tracking.
4. User feedback
In-app surveys and nudges for product feedback are another critical component of behavioral analytics. User behavior insights allow you to make recommendations directly from your users as they interact with and engage with your website or app.
Asking for feedback takes the guesswork out of product management and understanding your audience so you can make even better decisions.

5. Overall page navigation
When clicks, scrolling, and mouse tracking all come together, you can get an overall feel for how your users navigate different pages of your website or app. See what information they’re interested in, where they’re pausing to read more information, and what CTAs or images encourage them to move on to the next page.
With this information, you can rearrange the contents of your page to deliver a better user experience and improve your conversion rates.
6. Drop-offs
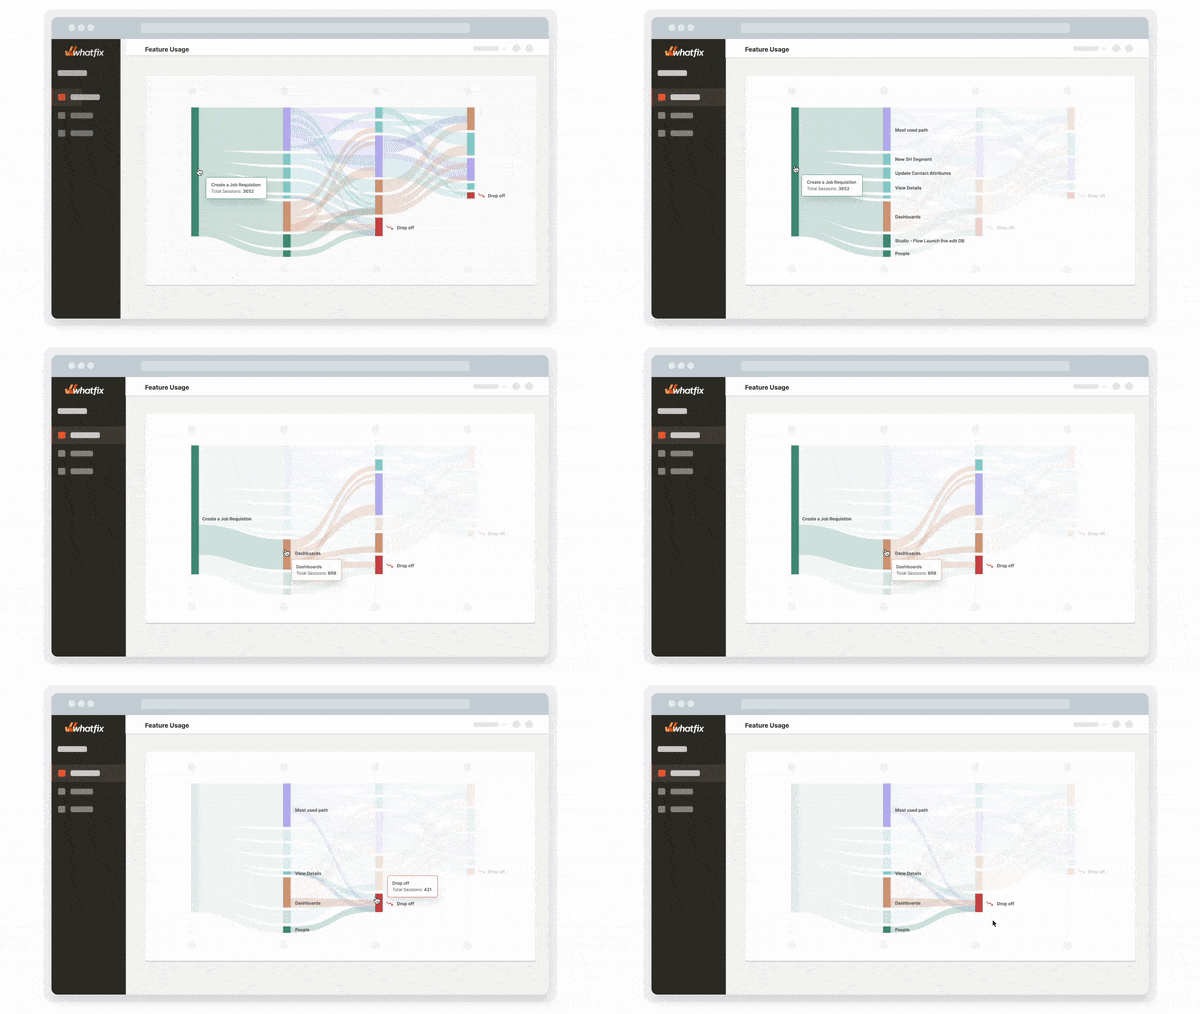
Knowing when a customer chooses to leave your website or app is just as important as understanding what information and content they engage with. With behavior analytics, you can find the point where your user loses interest and drops off.
Drop-offs are a sign that users are experiencing friction in their journey. Identifying high drop-off areas empowers you with the data to overcome these friction areas and build better experiences that enable end-users to achieve their desired outcomes.
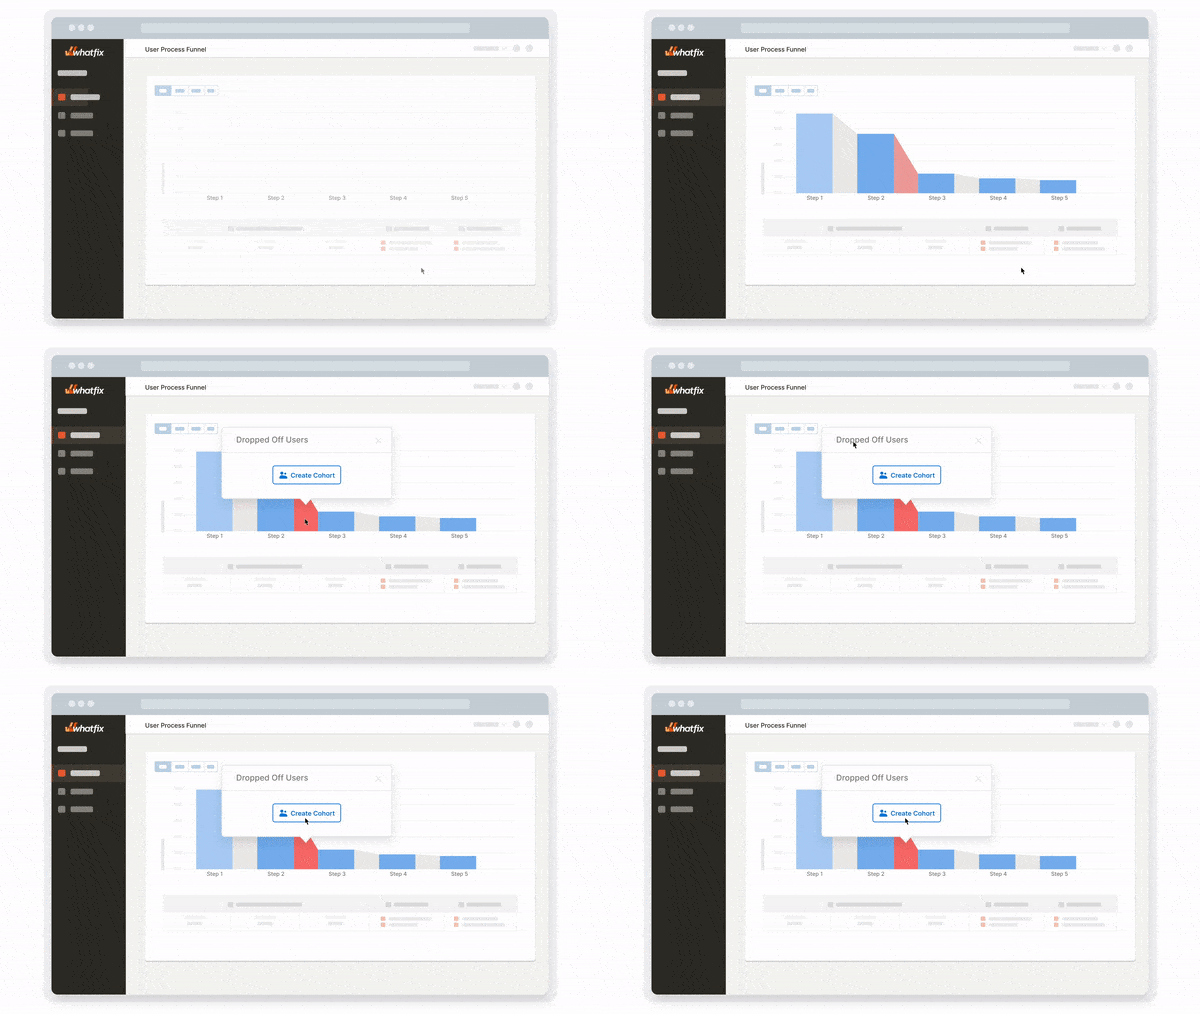


Drop-offs are a sign that users are experiencing friction in their journey.
7. Event completion
Standard analytics allow you to track significant conversions, but behavior analytics lets you look at more detailed event completions to track the micro-conversions that move users along the sales process.
Measure when a user interacts with a particular feature, engages with a CTA, or completes a form.

Related Resources
What Tests Can Be Run with Behavioral Analytics?
When you start collecting behavioral data, you’ll be empowered to run multiple types of user analyses and experiments to refine your product experience, based on the actions you want your users to take.
Here are the most common:
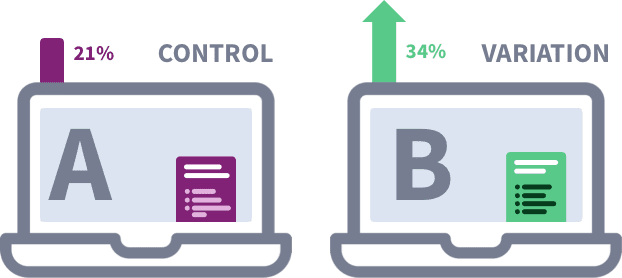
1. A/B tests
A/B experiment testing allows product managers to test two different variants against one another – whether that is the location of a new smart tip, the copy of a CTA, the number of fields on a form, and so forth.=
A/B tests allow product teams to take the guesswork of our product development and make product changes based on real data.

2. Funnel analysis
Every product team has a conversion goal for their website, app, or product. Anywhere along this user journey presents the opportunity for users to advance or fall off. A funnel analysis allows product managers to inspect various stages of that customer journey to fix user friction points and learn from experiences that are high converting.


3. User segmentation
User segmentation allows product teams to create cohorts of users and learn based on the profiles of these user segments and personas. Product teams can use behavioral data to group different types of users together, and then learn what works for different cohorts.
Benefits of User Behavior Analysis
Implementing and tracking behavior analytics takes time — but the rewards are high. Here are some of the biggest benefits of tracking behavior event data:
- Better user experience means higher product adoption: Equipped with behavioral analytics, product teams are empowered to make data-driven decisions that influence your product experience – which helps to drive product adoption.
- Understand your users better: With deep user behavior insights, product teams are able to understand what their users engage with the most, what distracts them, and how they interact with your product’s interface.
- Improved conversion rates. When your website or app works the way your users expect it to, you can increase conversion rates and keep your audience engaged longer.
- Higher customer retention. Improving your user experience helps reduce time-to-value and helps users find their “aha!” moment with your product. Helping present the real value of your product allows customers to find ROI from your tool, which is fundamental to customer retention.
- Decrease service and support costs. Creating an intuitive product or app will reduce confusion and complications for your users, reducing the amount of service and support you need to provide.
- Increase customer satisfaction. Happy customers mean higher customer satisfaction — and satisfied customers are more likely to recommend your brand to friends and family.
How to Get Started with Behavior Analytics
Ready to set up your behavior analytic tracking? Here’s how to get started.
1. Build a behavior analysis team
Behavior analysis is a division entirely on its own. While it shares many similarities with traditional analytics, it deserves undivided (or at least specific) attention from experts who understand how to read the data.
Behavior analysis requires understanding human behavior and making educated assumptions based on the information provided. Before you begin building your behavior analytic tracking system, create your team. Having analytic experts on your side during the implementation phase can ensure you’re checking all the right boxes.
2. Set your behavior analytic goals and metrics
As with any analytic endeavor, knowing what you want to track and why is fundamental for building a successful behavioral analytic system. Before you dive too deep, set your behavior analytic goals and metrics.
Look at where your team might have gaps from traditional analytics. Are users failing to move beyond your homepage? Are they struggling to find and engage with special features? Is your support team seeing a lot of confusion about how to navigate your app?
A few examples of user behavioral metrics to track include:
- Daily active users (DAU) or monthly active users (MAU)
- # of cart abandonments
- % of new users who completed their onboarding flows
- # of users using a specific feature
- # of free trial to paid account conversions
- # of users who started to fill out a form but didn’t complete it
Begin with a problem to solve. Then map and benchmark your product adoption metrics. Then discover what behavioral analytic tools are available to you.
3. Map out your processes
Mapping out your processes before you start tracking can keep everyone on the same page and ensure you’re getting the most from your analytics.


Within your process, consider:
- What particular KPIs and metrics you’re going to track
- How you’re going to measure those KPIs and metrics
- How you’re going to store data and information
- How often you’re going to pull data and information
- What reporting process you’ll follow for sharing data and information with other relevant departments and teams
4. Choose explicit or implicit event tracking
Event tracking is either explicit or implicit. Explicit event tracking requires manual tagging of events, while implicit collects all user interactions and data automatically.
Implicit event tracking is easier initially because it doesn’t require custom coding, but because it captures all information and data, your team is left sifting through more information at the end to find what is relevant and what is not.
Explicit event tracking requires developers to collect relevant information based on their metrics and goals, but the end product is much cleaner and more specific.
Each style has its benefits and drawbacks, so choosing based on your unique goals and the team’s skill level is important.
Read our comparison guide that breaks down the differences between explicit and implicit event tracking, the use cases for each, and the benefits and challenges for each.
5. Implement your strategy and start tracking
With the foundation set, you’re finally ready to start tracking. Remember, making changes and adjustments to your tracking process is okay. As your goals change, so will the metrics you track.
Challenges to Implementing Behavior Analytics
There are barriers to setting up behavior analytics tracking – here are the most common challenges organizations face when looking to implement behavioral analytics:
- Setting the right goals: Behavioral analytics will unlock a wealth of data. Product teams must focus on granular product-related challenges and set the right goals to accompany this problem. Product teams will fail to find the ROI of behavioral analytics without setting the right goals.
- Lack of engineering and technical resources: Product teams need developers to help implement and manage behavioral analytics strategies for custom explicit event tracking. Without the support of engineering teams, organizations should look to implement an implicit event tracking framework.
- Too small or dirty data sets: A challenge when starting with product analytics is working with unclean data, or with small data sets. Both of these present data that may not be representative and raise false flags, which can lead product teams down rabbit holes based on poor data quality.
What Is a Behavior Analytics Tool?
Behavior analytics tools are software platforms for collecting and analyzing user data to help you understand how people interact with your resources — your website, products, downloadable resources, landing pages, etc.
Behavior analytics starts with asking several questions, such as:
- What elements do users interact with most?
- Which features do they ignore and hardly ever interact with?
- Which pages do they visit and how often?
- What actions do they take before leaving your website or application?
- Where do they struggle, spend more time on page, or become unresponsive while using your website or product?
The ultimate aim of behavior analytics tools is to reduce friction, improve user retention, drive conversions, and increase overall product adoption— to do that, you need to study what people encounter on your online assets and figure out how to simplify their user experience.
A behavior analytics tool observes how individual users interact with your online assets so that you can figure out how to:
- Optimize elements to work better.
- Offer a better user experience.
- Localize your offer for specific geographies and regions—depending on where users are located, the elements they use most, and their likelihood to convert.
To achieve that, behavior analytics tools use several mechanisms to capture user experience and product adoption metrics that show how people are interacting with your online assets.
User behavioral analysis software enables teams with the following capabilities:
1. Activity maps
An activity map tracks where your users access your website or product and segments that data into countries, regions, cities, etc. That data can be used to improve user experience in several ways:
- If you have a significant number of users coming from a bilingual country, consider localizing your website or product so they can have a version available in their local language.
- Create offers tailored to users in specific geographical locations.
- Restrict access for IP addresses from certain regions where your website has been attacked from.
- Provide support in the local language for particular regions.
Activity maps track signups, usage, and incidents so businesses can localize their services and better serve international users.
2. User journey mapping
User flow maps show the sequence of events users perform after they land on your website, sign into your product, log into your application. If you can track the user journey, you can figure out which elements to improve, maintain as-is, or remove entirely.
- Where do most user sessions end? Make that element stand out so that it’s easy to locate.
- Do users for a specific region always end their user journey on a particular page? Create a local website version and highlight that particular feature or function.
- Remove the hoops users need to jump through to find your most-used features.


3. Funnel analysis
Funnel analysis reports track how users progress through the different conversion stages.
Whether you’re a marketer, a content creator, or a growth engineer trying to reduce time to value (TTV), boost conversion rates, or simplify your user onboarding experience, understanding where users and visitors end up in their journey with your product will help you:
- Track which part of the funnel where users drop off.
- Determine where your high-quality visitors come from so you can double down on those channels.
- Find your high-traffic, high-exit pages where you can
Funnel analytics helps ensure you know why (or why not) your users are converting and how you can optimize your product marketing process to offer more value.


4. Heatmaps
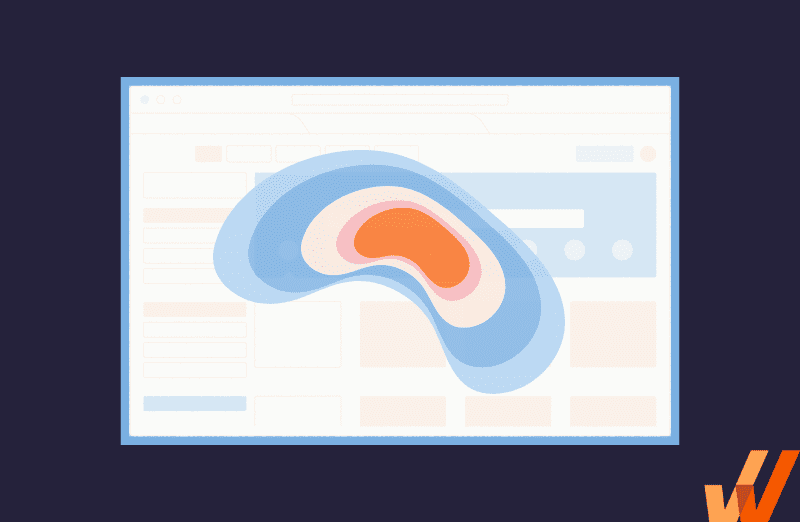
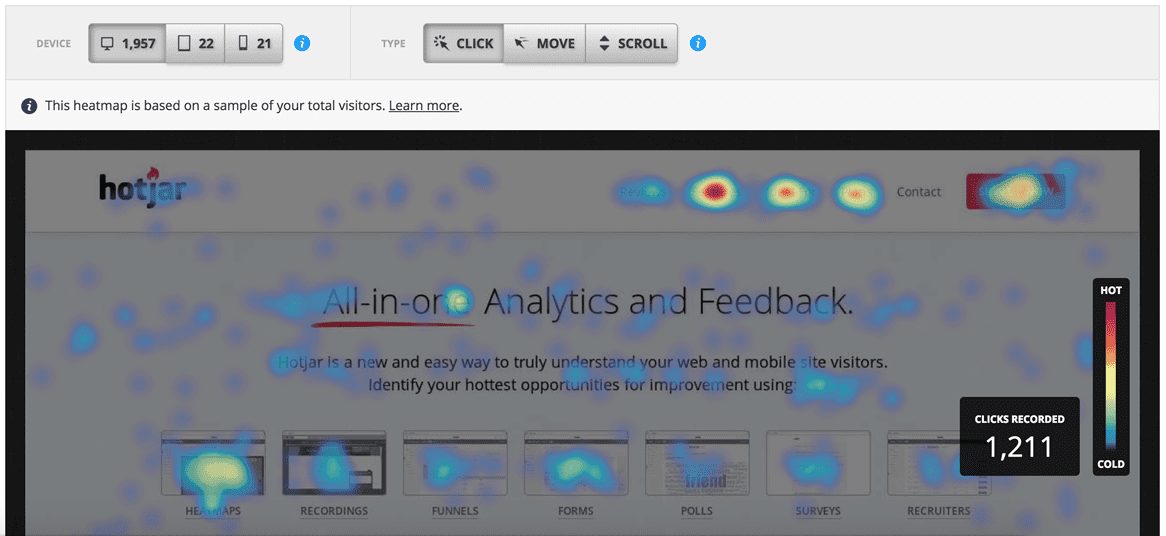
Heatmaps track the elements users interact with the most and the least, using colors on a scale of red to blue. Heatmaps help you aggregate user experience data across several sessions and measure their average user experience by tracking:
- Whether users are seeing functional page elements or getting distracted by non-clickable content.
- How far do users need to scroll or navigate to find resources?
- Any issues users are encountering across devices.
Heatmap shows engagement with a page or website, including clicks and scrolling. With a heatmap tool, darker or red areas will show high-traffic areas. “Colder” areas typically appear to be purple or even black.
A single customer hovering over CTAs, links, and elements on your pages probably doesn’t mean much. Heatmaps help you collect hundreds and thousands of them to see patterns of what to improve in your user experience.


5. User cohorts and segmentation
With cohort analysis features, product teams can understand how contextual segments of users are engaging with a product, its features, and its workflows. This allows team to create contextual, personalized journeys and flows for specific cohorts.


Best Behavior Analytics Software
Here are the eleven best behavior analytics software, with a breakdown of each product’s features and how you can leverage them to track and improve the user experience for your website and products.
1. Whatfix
- G2 Review Rating: 4.7 out of 5 stars
- Price: Contact us for custom pricing
Whatfix is a digital adoption platform that provides no-code content creation tools that empower product managers to create in-app content, as well as capture and analyze product analytics.
With Whatfix, product teams can build in-app guidance such as step-by-step walkthroughs, product tours, onboarding task lists, and self-help support widgets within an application.
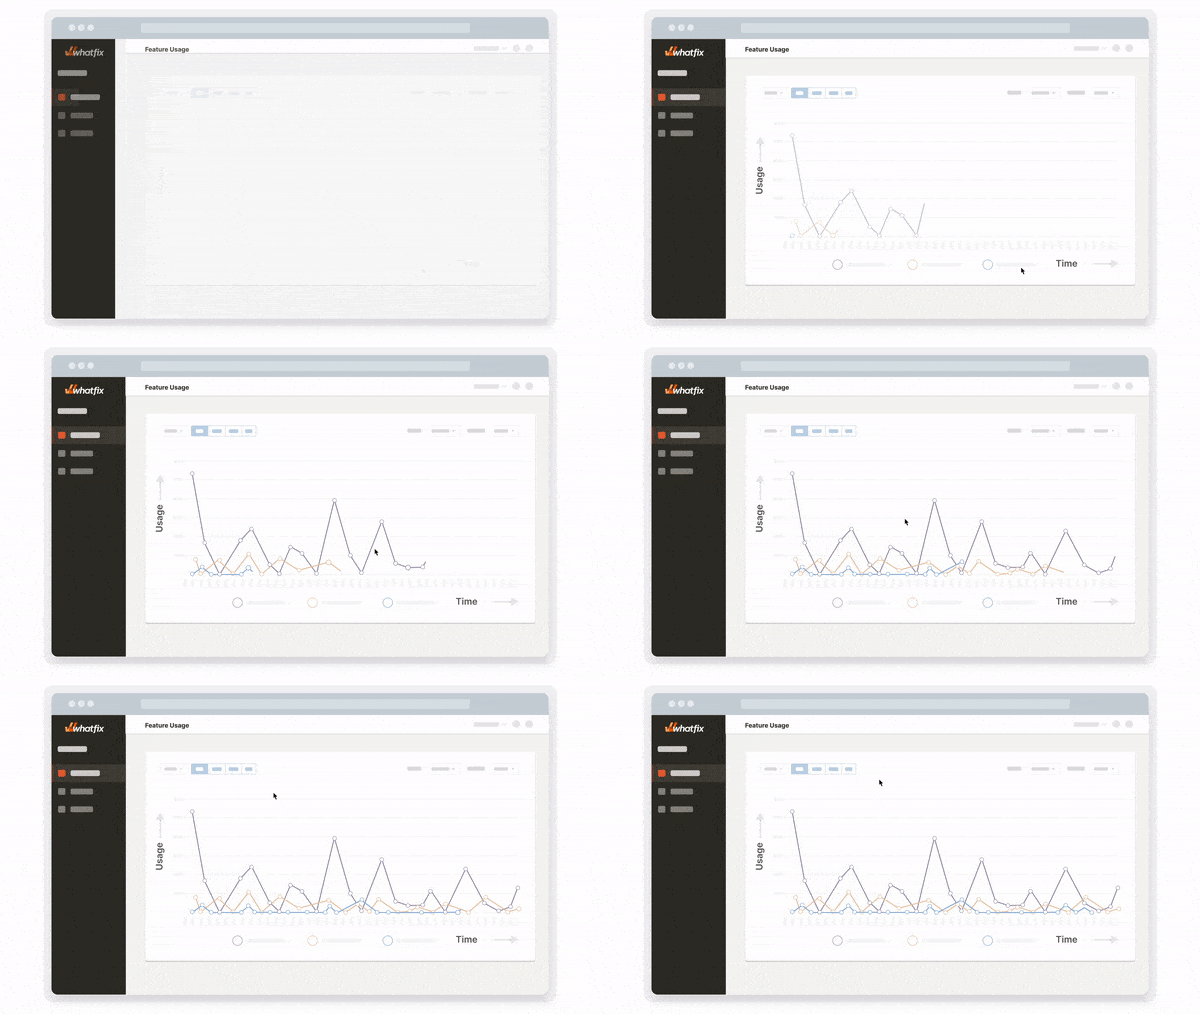
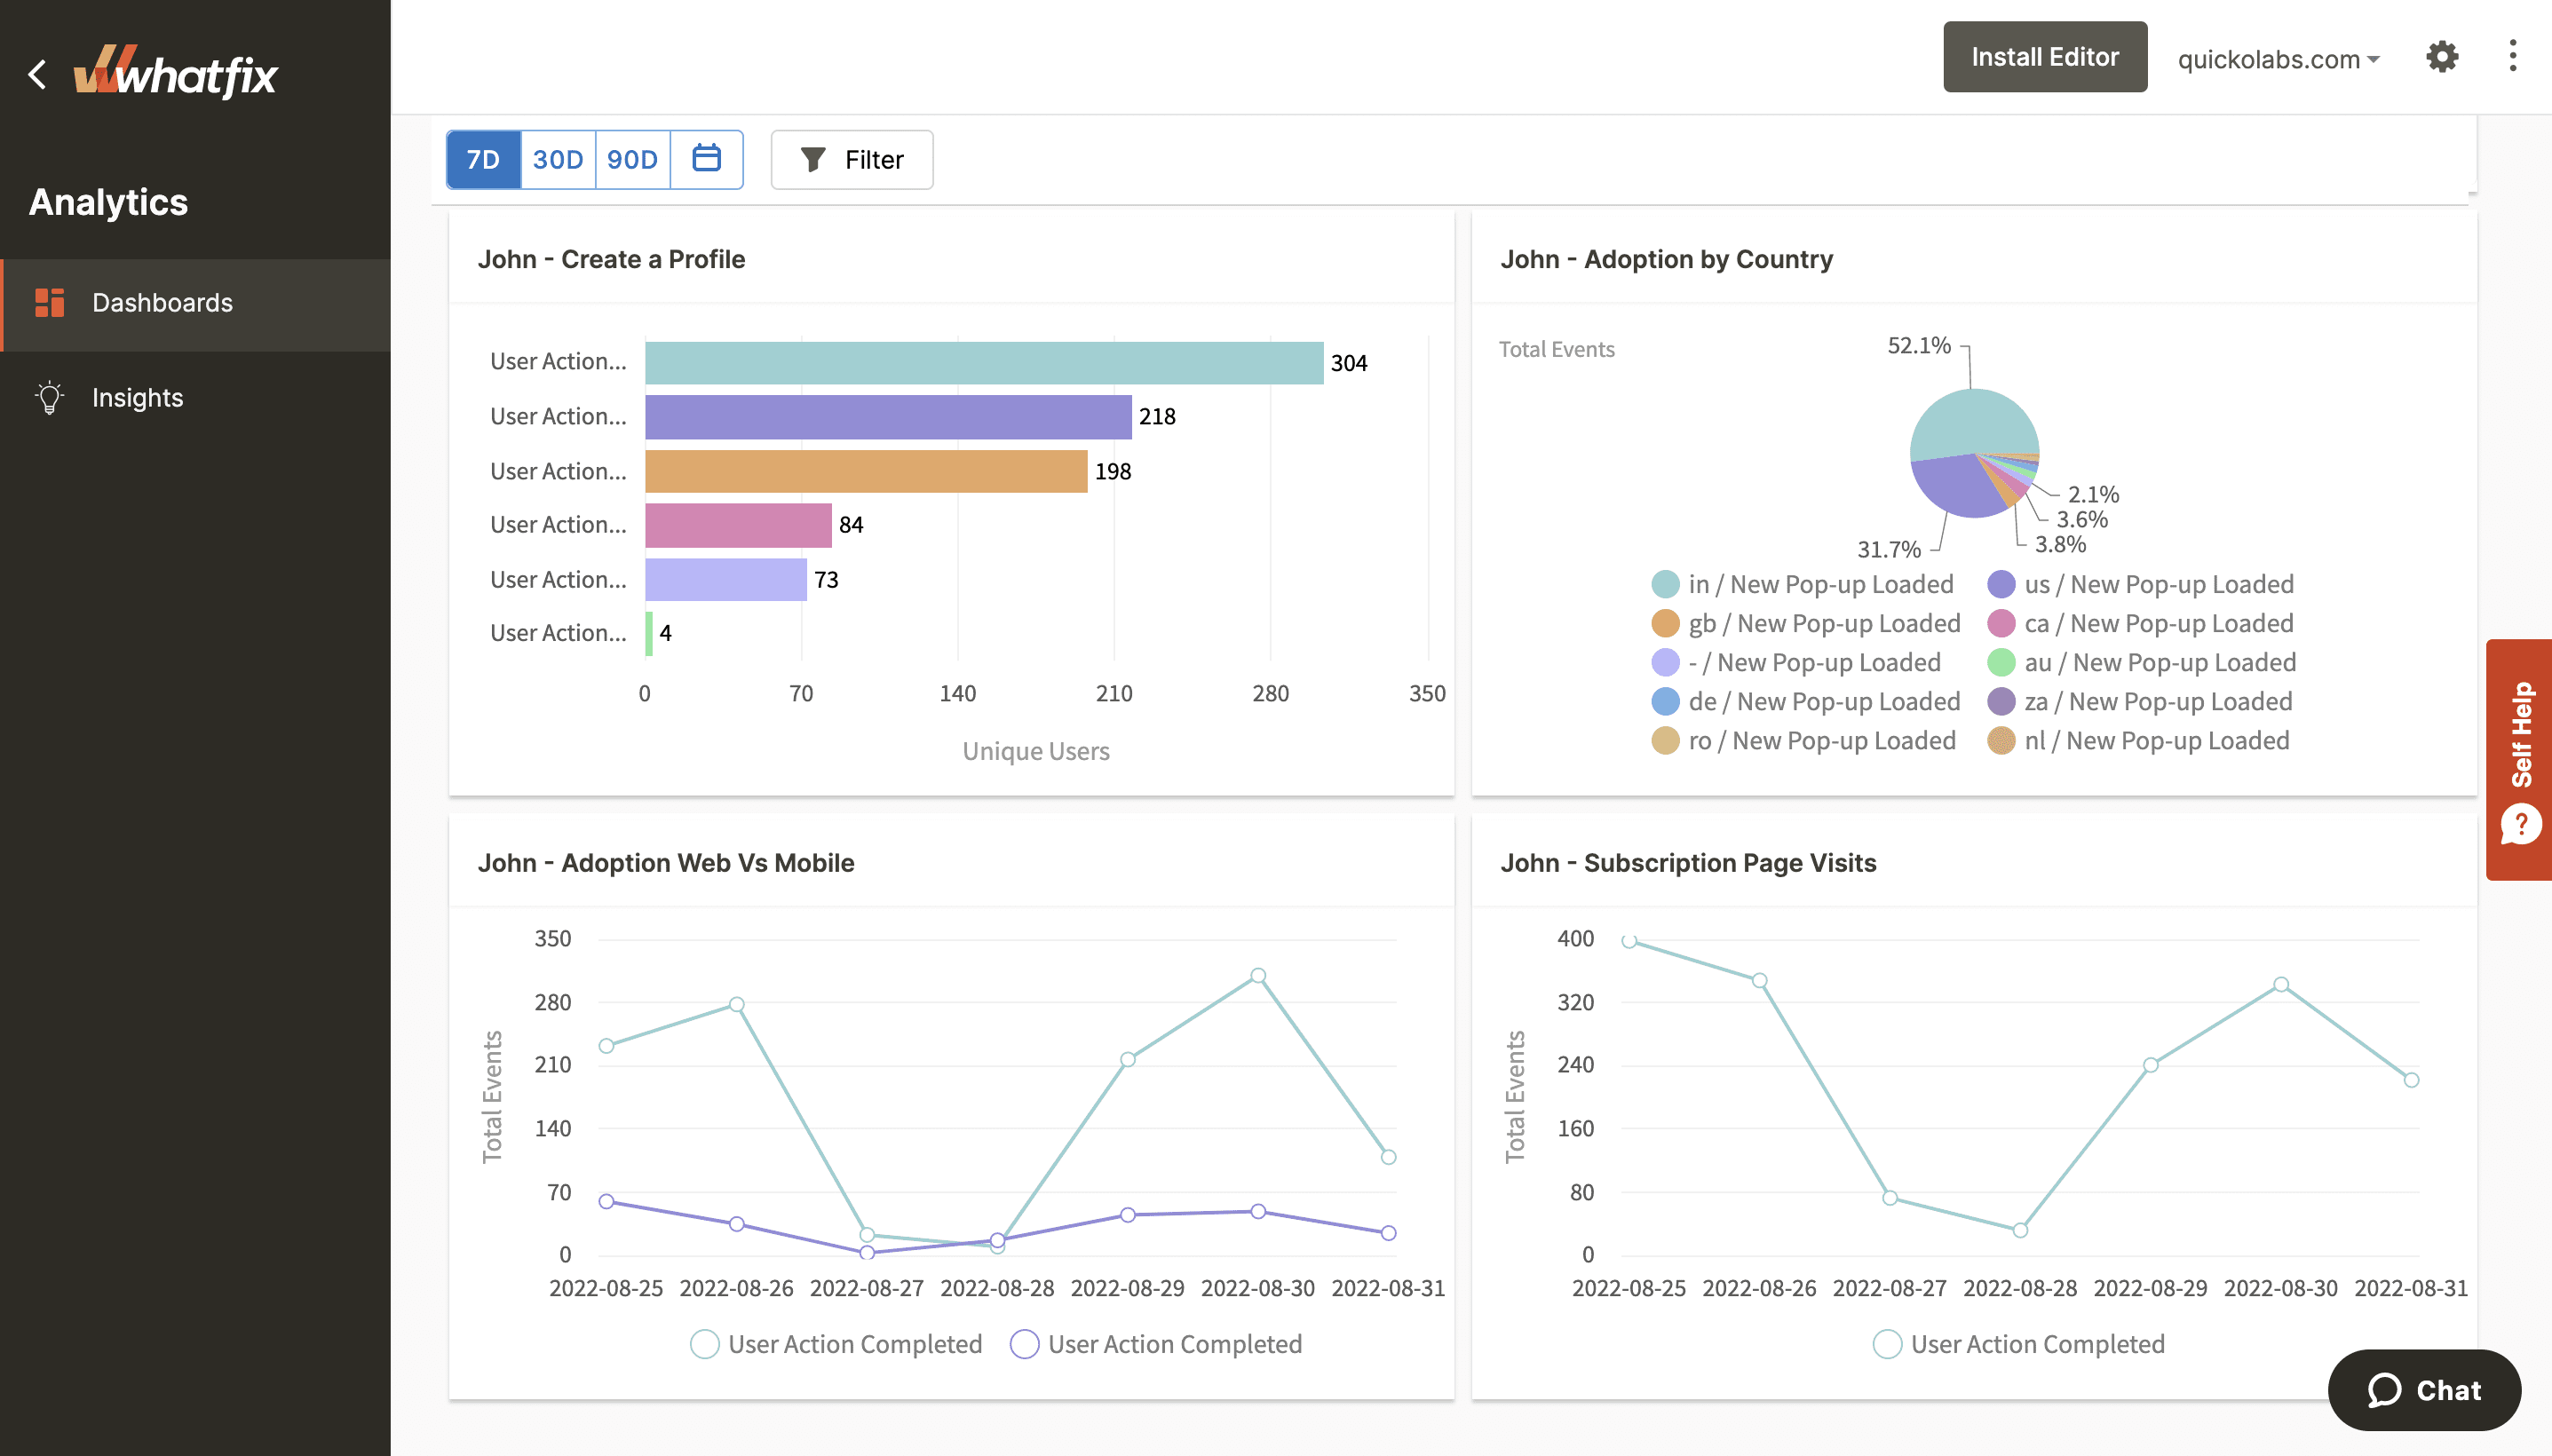
With Whatfix Analytics, capture user behavior insights into product usage and adoption. With Whatfix, you can identify dropoff areas, build user cohorts, measure feature adoption, map user journeys, and track custom event conversions.


With Whatfix Analytics, product managers are empowered to capture and analyze user behavior insights into how individual features, flows, and the overall products being used. With Whatfix, you can identify key drop-off spots, where users look for additional assistance, and what features or areas of the app users are most drawn to.
You can then adjust your user experience to reduce support queries, improve customer satisfaction, and improve adoption rates.


What sets Whatfix apart is its hybrid approach to event tracking that allows product managers to create custom, explicit event tracking parameters in a no-code, implicit-like implementation. This means there is no reliance on engineering to help get your event analytics tracking live.
Ready to get started? Set up a no-stress Whatfix demo now!
2. Amplitude Analytics
- G2 Review Rating: 4.5 out of 5 stars
- Price: Limited free tier; paid tier reportedly starts at roughly $995 per month
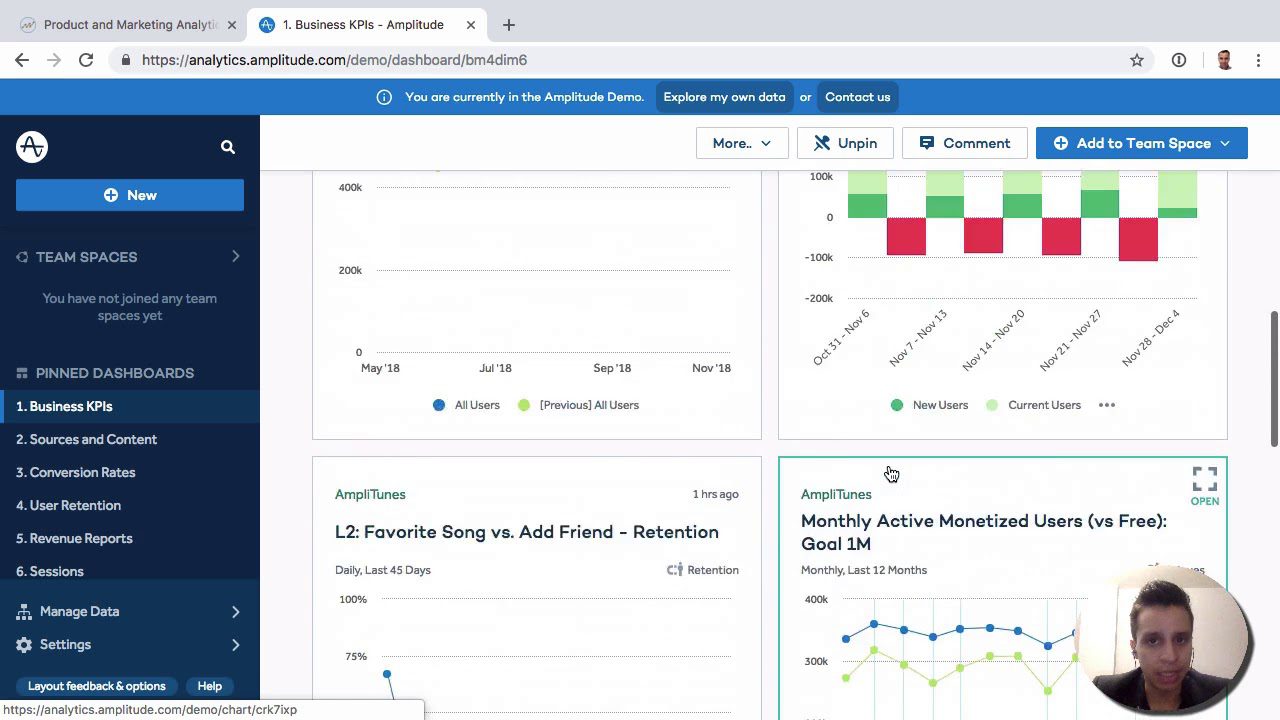
Amplitude is a product analytics platform that captures user behavior data that allows product managers and marketers to make data-driven decisions to drive product adoption and signups. It is built for product and marketing teams that want to:
- Figure out how their users are engaging with their online properties.
- Test different versions of the same asset to monitor conversions and goal completions.
- Recommend helpful resources personalized to individual users.
- Segment users to help you target them with more relevant offers.
Amplitude works across mobile and web resources (landing pages, applications, etc.). Like Mixpanel, Amplitude is an explicit event tracking tool that has a highly technical implementation that requires significant support from engineering teams.

3. Mixpanel
- G2 Review Rating: 4.5 out of 5 stars
- Price: Limited free tier; paid tier starts at $25 per month
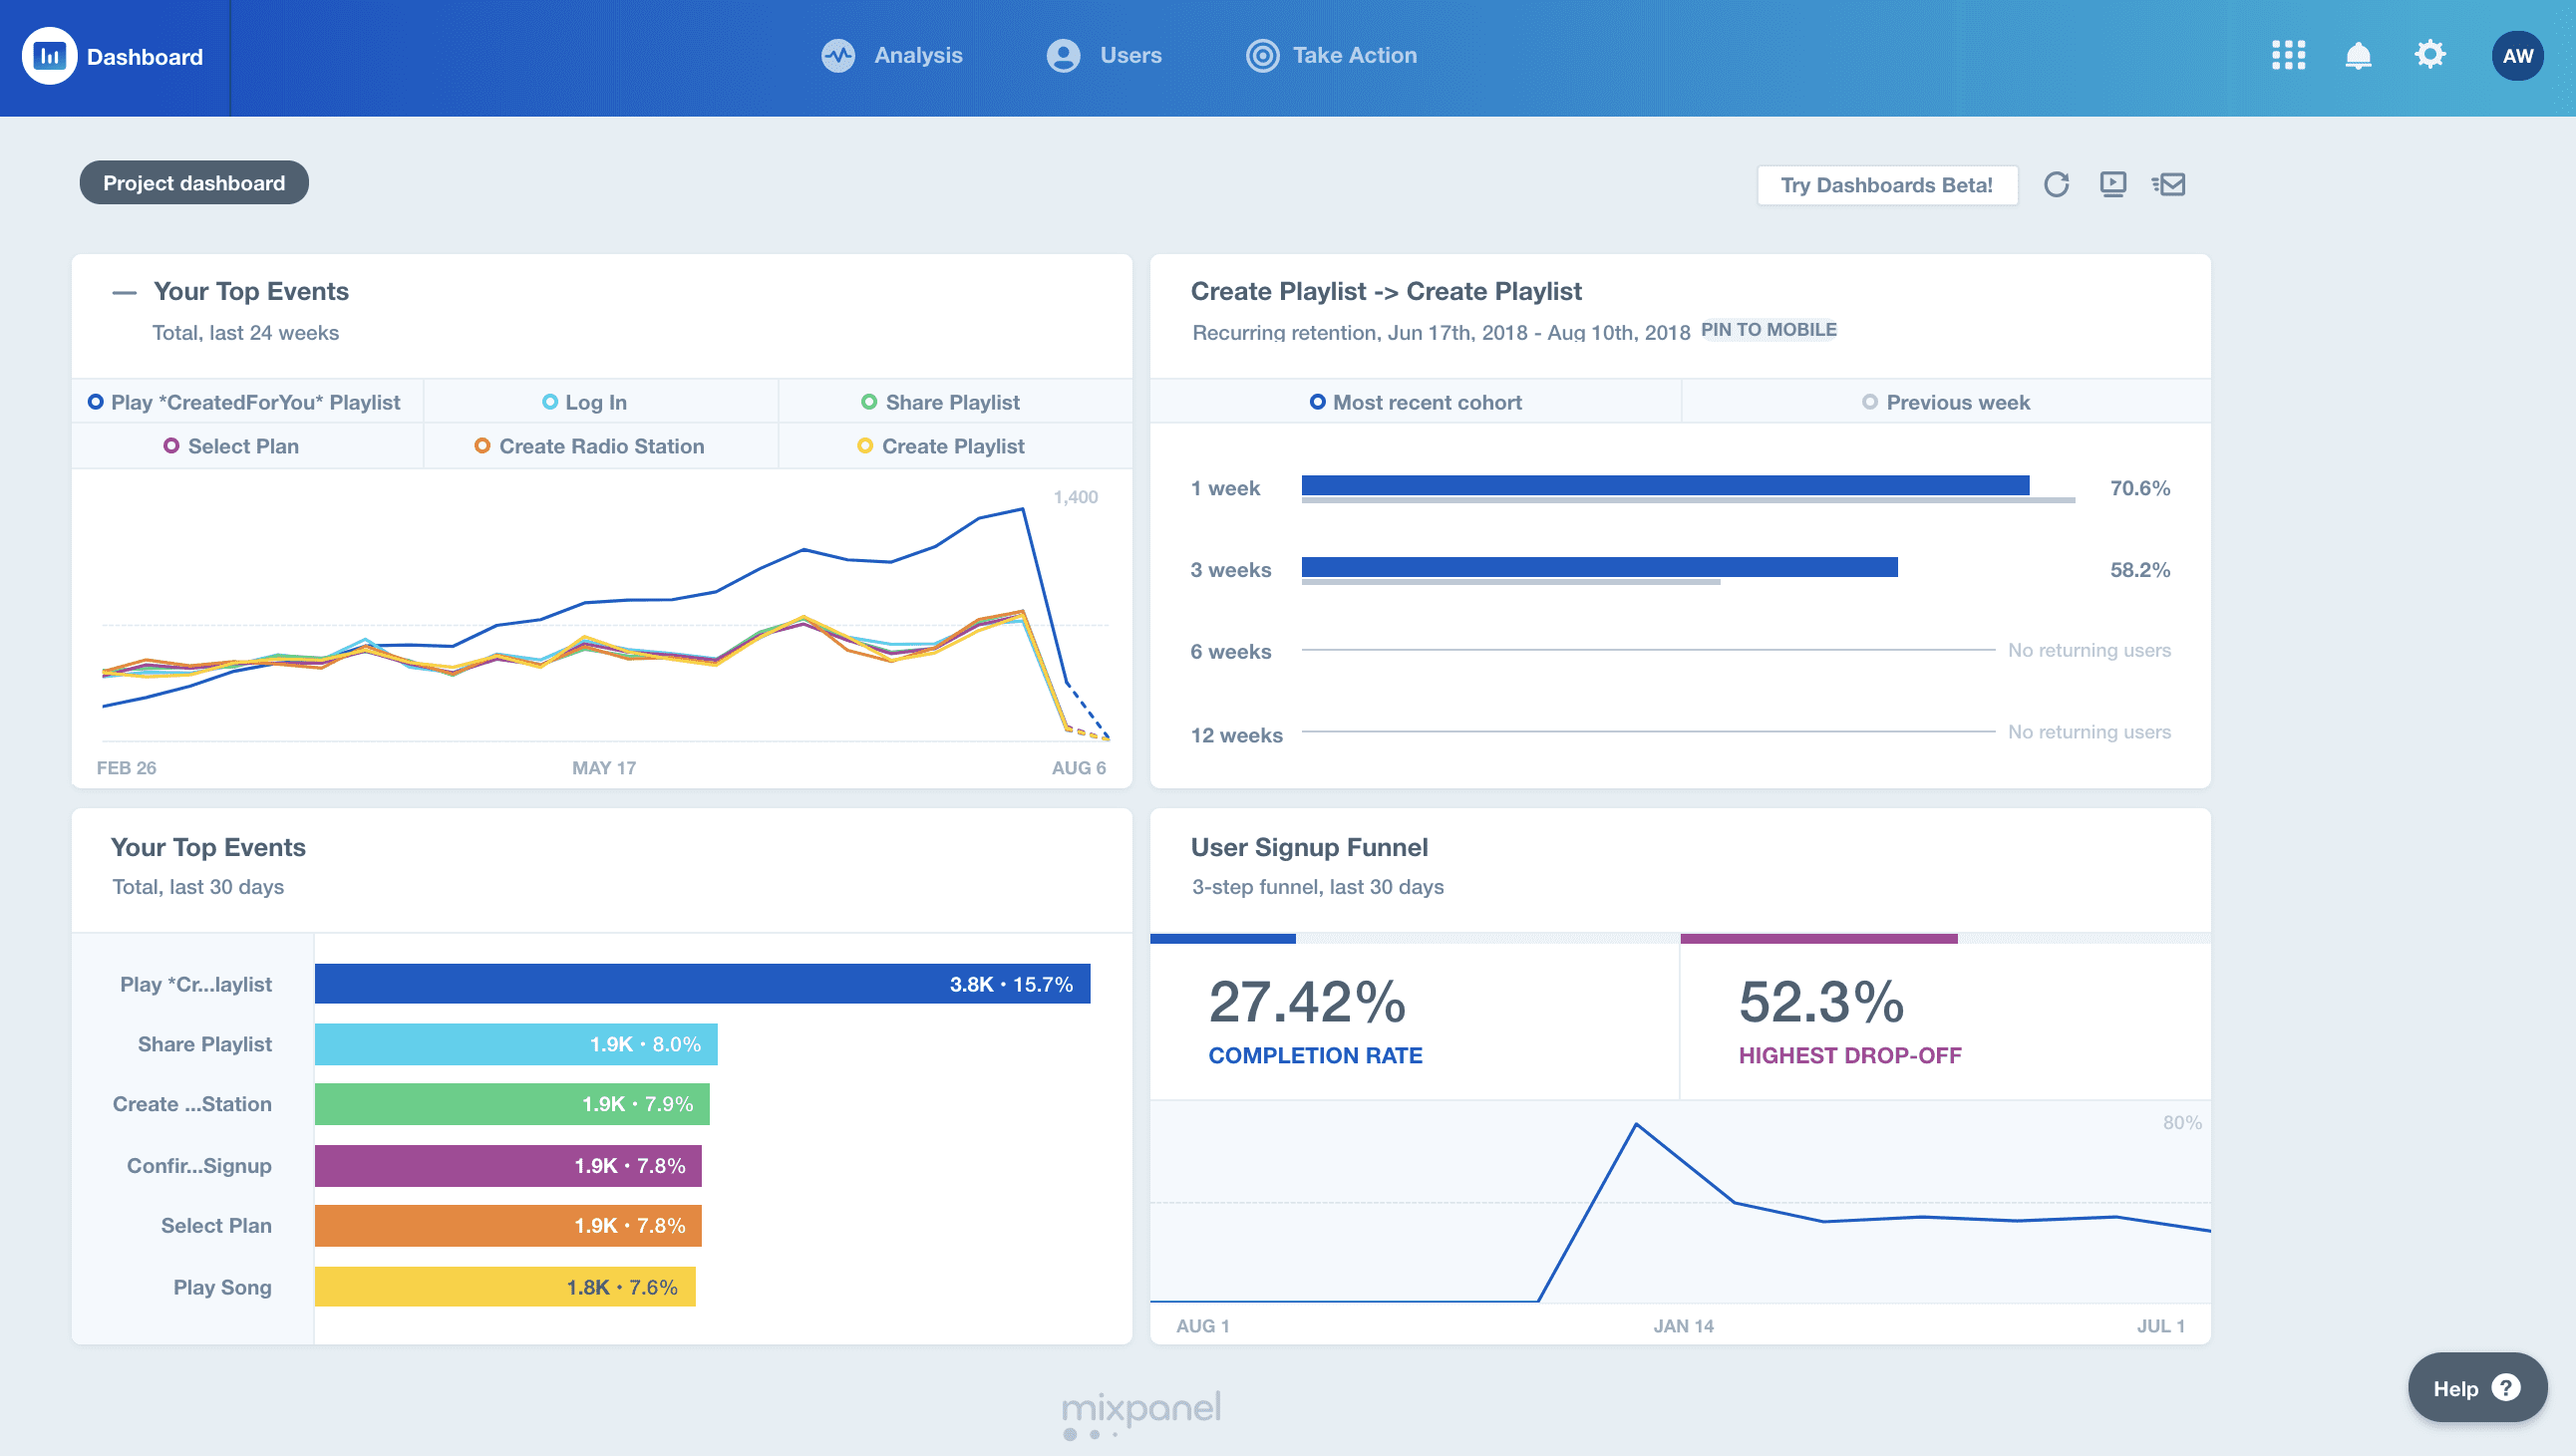
Mixpanel is a behavior analytics suite designed to help product teams track user interactions across mobile and web resources.
It offers cohort segmentation, integrations with your product and data stack, and engagement metrics rendered in interactive reports and engaging dashboards, where you can track metrics in real time.
A challenge of Mixpanel is that it requires product managers and growth marketers (or anyone who needs to use the platform) to create rules for what behavior metrics they want to track and then rely on engineering support to build, manage, and update a code-based implementation.
This is known as explicit event tracking, allowing organizations to create custom event tracking parameters. However, this reliance on development support means it’s not a great solution for agile teams or teams that may not have the engineering support to fully take advantage of Mixpanel’s platform.

4. Pendo
- G2 Review Rating: 4.5 out of 5 stars
- Price: Reports place Pendo’s features in the $2,000 – $5,000 per year bracket, per product
Pendo can seem like a handful for a marketer or product manager who’s looking to track user engagement with its digital adoption platform—it does everything from user onboarding to product engagement, website personalization, analytics, and road mapping.
Marketers and product teams that use Pendo can:
- Segment and track user behavior across mobile, web, and internal apps.
- Create better product roadmaps for customers and internal product developers.
- Connect Pendo’s behavior analytics tools with the rest of their marketing and product stack.
- Track product usage to figure out how to dedicate resources to product features.
Depending on your team’s size and where you’re at in your product’s journey, Pendo can either be a great fit, a bit unwieldy, or it can even get in the way with all of its many features.
And did we mention that Pendo is expensive? Reviews on Capiche have prices starting at $2,000 – $5,000 per year for a single product, and around $12,000 per year for the lower-tier package – which may drive you to explore Pendo alternatives, like Whatfix.

5. Hotjar
- G2 Review Rating: 4.4 out of 5 stars
- Price: Limited free tier; complicated usage-based pricing
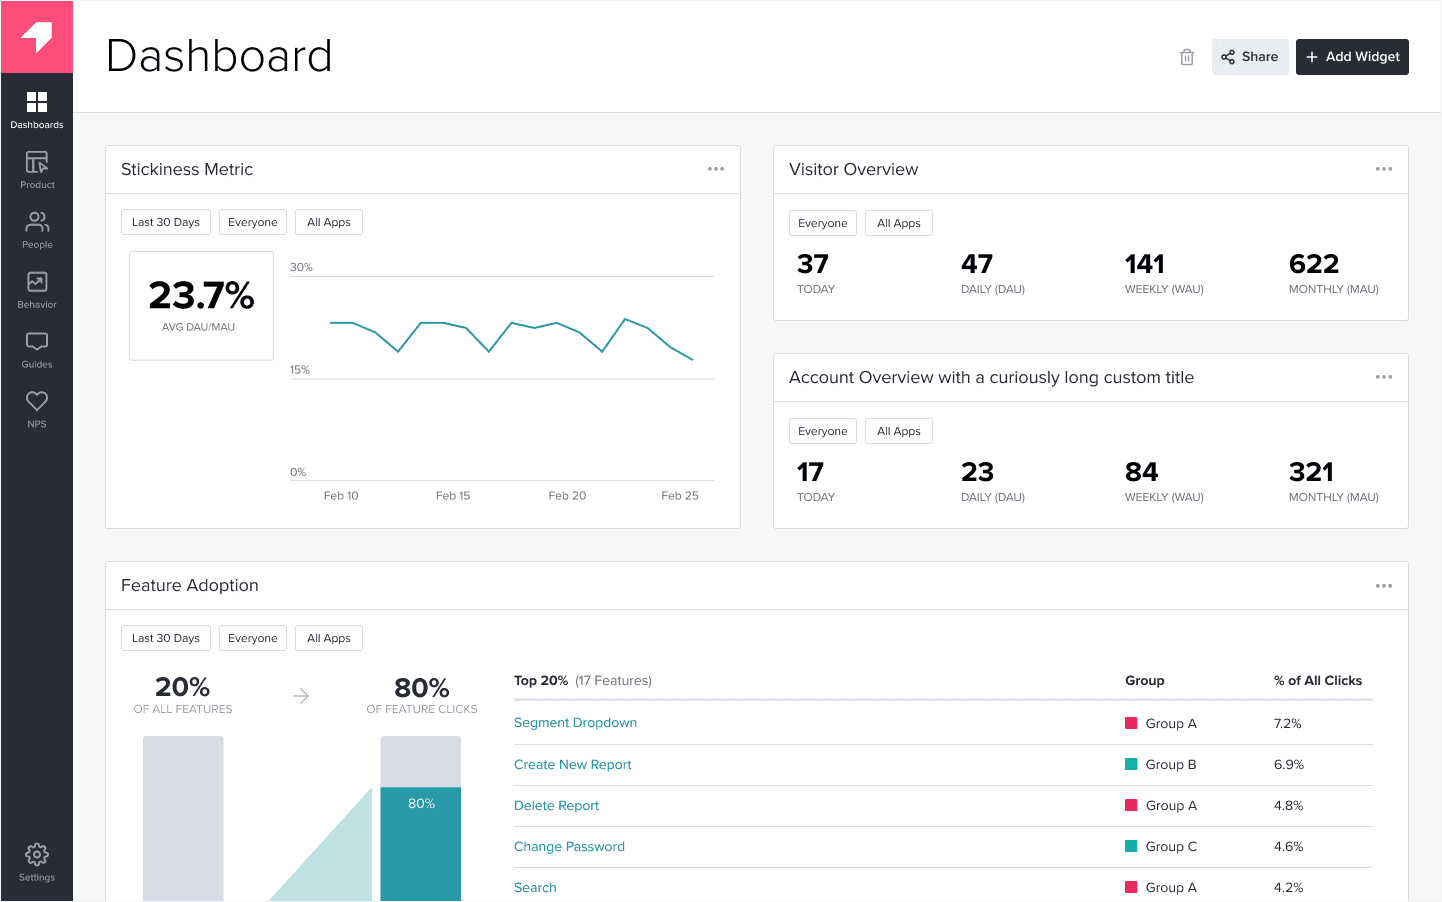
When you first learn about Hotjar, you assume it’s just a heatmap product that shows how users engage with individual webpages. And yes, but there’s more: Hotjar is an entire customer experience suite product and marketing teams use to:
- Capture user feedback with surveys.
- Record live sessions to track customer behavior in real-time.
- Aggregate multiple sessions into heatmaps.
For instance, a customer can grade and leave feedback on individual pages. A marketer going through their feedback can replay their session to figure out what their experience looked like and find how to improve it.


6. FullStory
- G2 Review Rating: 4.5 out of 5 stars
- Price: Starts at $199 per month; Free startup plan
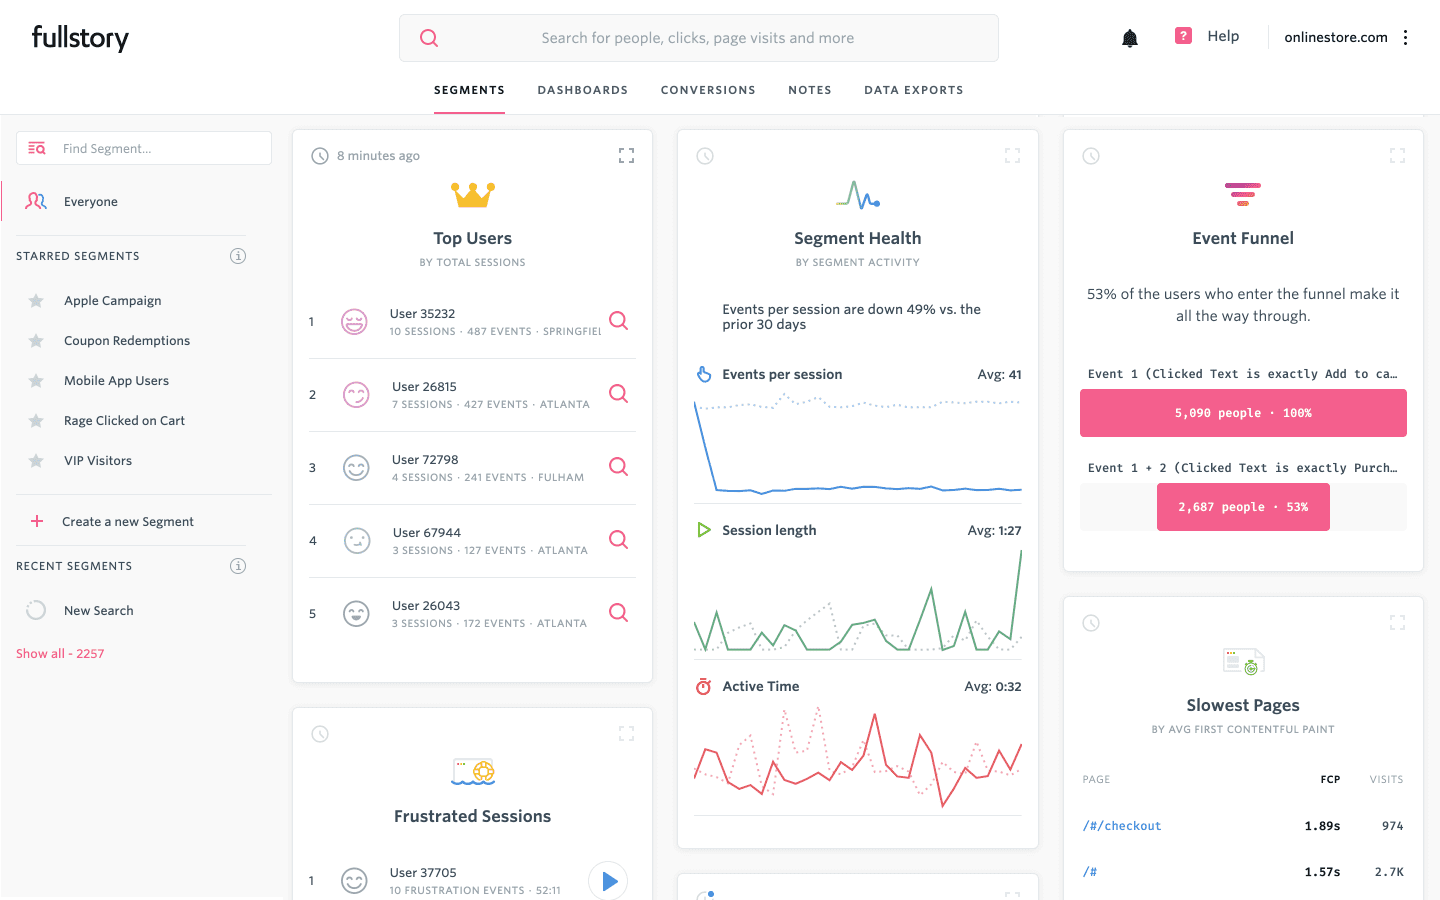
Fullstory is a digital experience platform (DXP) designed for marketers and product developers who want to:
- Gain deeper insights into the user experience on their web properties.
- Capture and document the entire customer journey.
- Track frustration signals and follow customers throughout the funnel.
- Replay individual sessions or aggregate them into heatmaps.
On the downside, Fullstory is quite expensive, and pricing only goes up if you want to monitor more sessions. The product can also be quite laggy when you start capturing live sessions — or the more of those that you capture.

7. Heap
- G2 Review Rating: 4.3
- Price: Limited free tier; paid tier starts at $3,600 per year
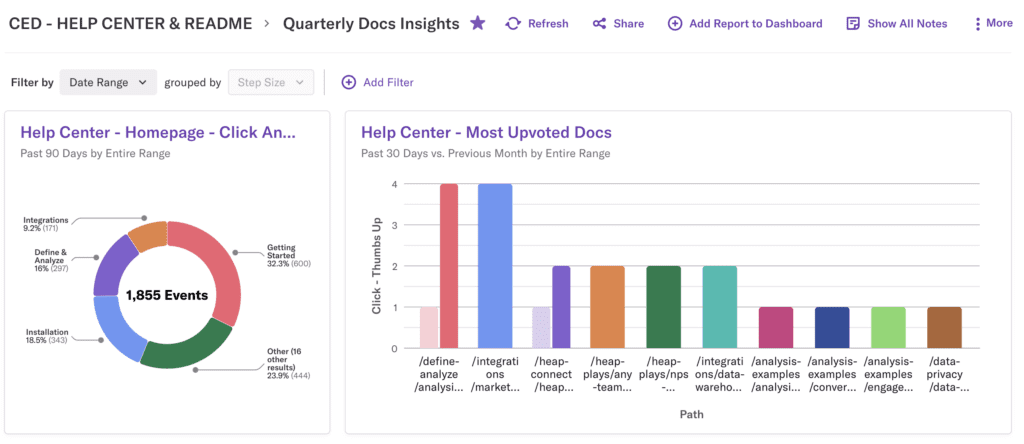
Heap is a behavioral data platform over 8,000 product teams use to track user insights, create memorable digital experiences, and decide what to build, how soon, and how much resources to allocate.

8. Smartlook
- G2 Review Rating: 4.6 out of 5 stars
- Price: Limited free tier; paid tier starts at $39 per month
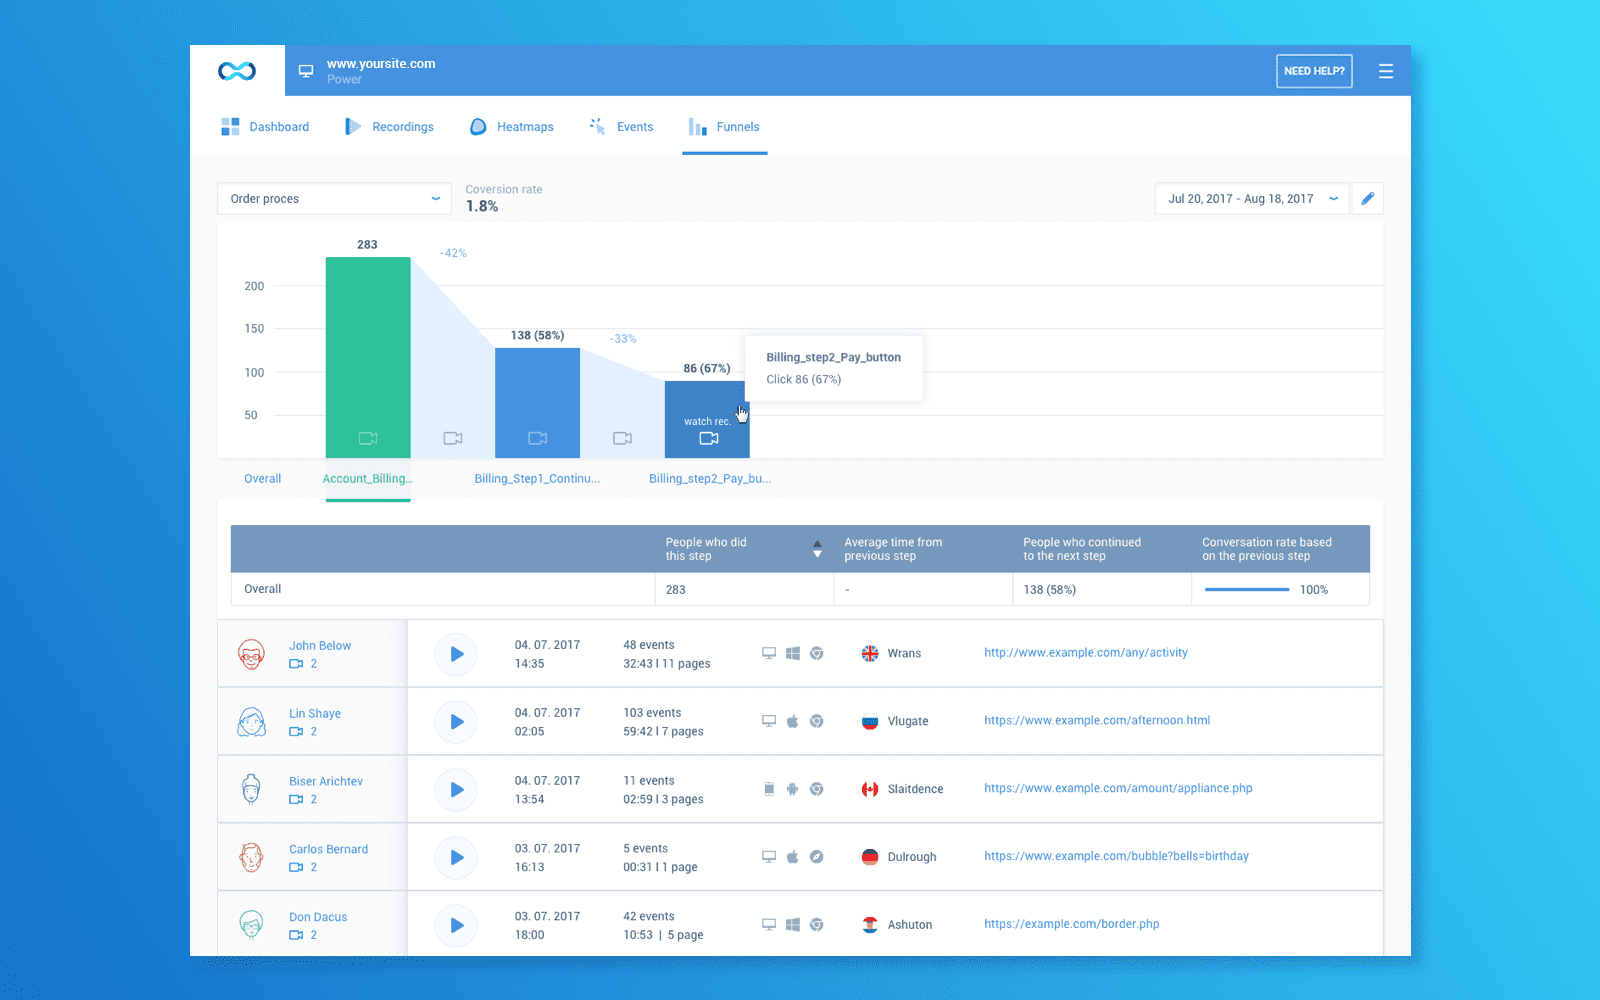
Like its peers on our list, Smartlook combines A/B testing, heatmaps, cohort analysis, and funnel analysis into a behavior analytics platform you can use to improve conversion on your mobile app and web assets like your landing pages, e-commerce product pages, help documentation, etc.
- Record and replay individual session recording — even better, skip to the highlights.
- Track which actions users perform and how often.
- Analyze where and why users drop off the funnel.
- Use heatmaps to measure the most important elements on your pages.
Smartlook offers free analytics both for mobile and web, while most of its peers focus on web assets and mobile web.

9. CleverTap
- G2 Review Rating: 4.5 out of 5 stars
- Price: Starts within the $200 per month range; prices go up to $60,000 per year for heavy users
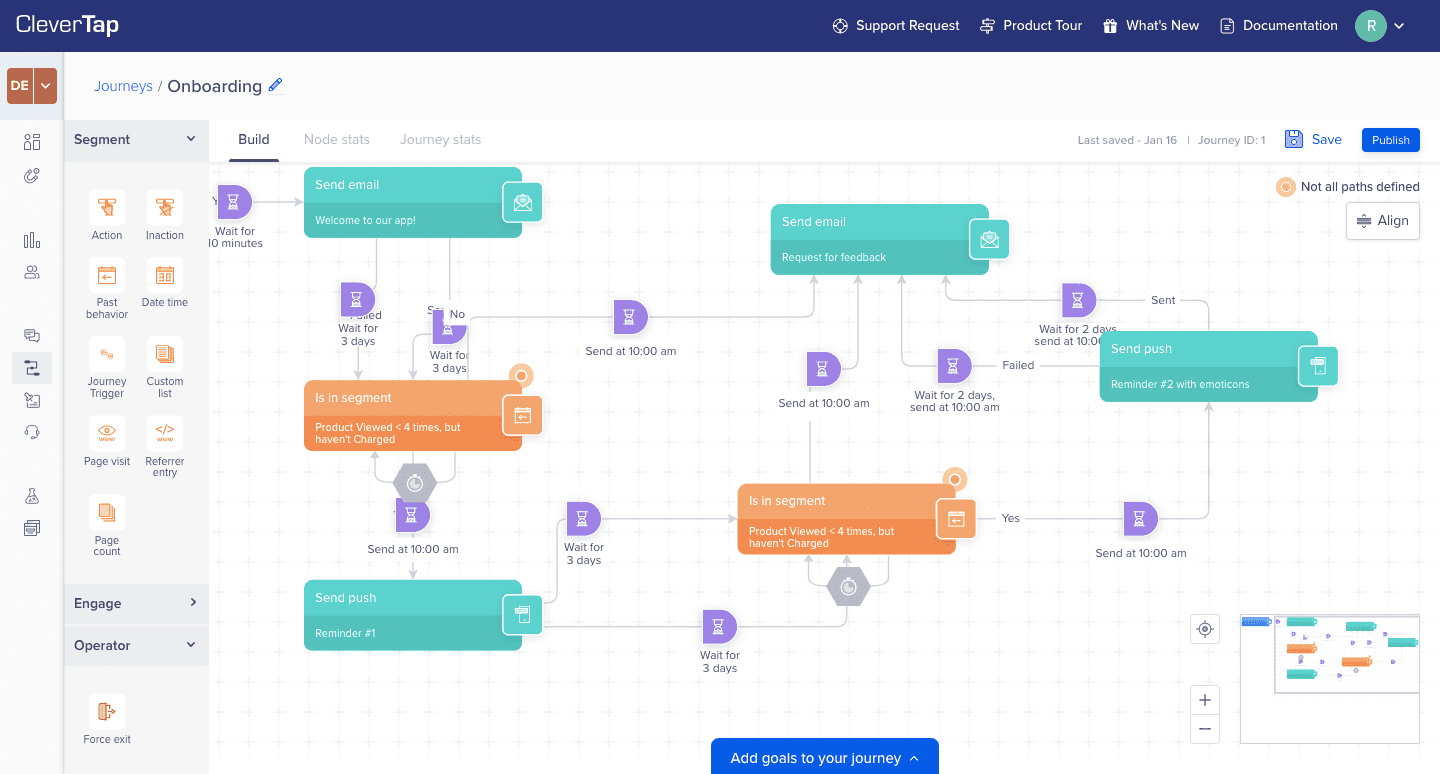
CleverTap is a customer engagement and retention platform that marketers can use to combine analytics into one source of truth where they can:
- Segment users based on how they engage with their assets & target them with relevant campaigns
- Analyze individual campaigns to understand how they affected conversions & engagement
- Track actions and figure out the actions users are taking
CleverTap can be very confusing to navigate. It tries to do too many things out of the box — messaging across Whatsapp, email, push notifications, and popups, campaign optimization, user journey mapping, segmentation, and individualization for better targeting.
Yes, all of these are nice to have, but they can be overwhelming if all you need is a behavior analytics platform vs. all the enhancements CleverTap offers.

How to choose a behavioral analytics solution (and why it should be Whatfix)
Behavior analytics can take your data and insights to a whole new level. By implementing a tool that lets you get to know your users and audience better than ever, you can build products and websites that truly meet their needs — not something you assume will meet their needs.
Before deciding on a behavioral analytics provider, answer the following questions to help guide your decision:
- Do I need behavioral analytics software for a mobile, web, or desktop application?
- Do I need to capture user and event data?
- Do I need access to data in real-time?
- Do I implicit or explicit event tracking?
- Will I have engineering support to help implement and manage our new analytics tool?
- Will I have the tools and resources to take action based upon our behavior data insights and create new in-app content, or will I need to rely on developers?
The bigger question should be, how often do users find what they’re looking for on your website?
Are your users fitting your product and resources into their daily workflow, or is it still business as usual? How many hoops do visitors have to jump through before they find the sign up page or your help docs?
Whatfix Analytics can help you find out. Our platform offers usage insights that will help you understand how individual users use your products and resources, the challenges they’re running into, and how you can redesign the user experience to be more accessible.
With Whatfix’s digital adoption and product analytics platform, non-technical product managers are empowered with no-code tools to implement behavioral event tracking, automatically generate analytic reports, set up and publish A/B tests, and create entire new user experience flows and in-app messages.

You get started by learning more about Whatfix Analytics here.


