What Is Customer Retention? 13 Strategies, Key Metrics, Types
- Published:
- Updated: July 23, 2024


No matter how strong your customer acquisition stream is, if you have higher customer churn, your revenue will suffer, and company growth will stagnate. Eventually, you might even churn through your entire potential customer base, jeopardizing your business’s survival.
Customer retention strategies enable organizations to retain their customers by offering world-class experiences, from support resolution, customer onboarding, continued customer education, and account expansion.
The right customer retention strategies empower organizations to cultivate new customers into longtime brand evangelists and power customers.
In this article, we’ll explore the importance of customer retention, lay out thirteen proven retention strategies across the customer lifecycle, and share sixteen must-track customer retention metrics.
What Is Customer Retention?
Customer retention refers to the ability of companies to retain new customers and turn them into repeat buyers. Customer retention can indicate whether the product you are marketing matches your customer expectations. It can also highlight low-quality experiences and pain points customers may face in the customer lifecycle, from poor support to bad onboarding.
User retention vs. customer retention
User retention is often confused with customer retention. While similar, their differences matter.
While user retention looks at anyone who regularly interacts with your product or service, customer retention measures people who regularly pay for it. For example, retained customers frequently re-up a paid monthly subscription.
If you offer a paid subscription service, you’ll measure customer retention instead of user retention. It’s also crucial to look at if you’re working off a freemium model — comparing your user retention rate with your customer retention rate can offer insights into which features are the most engaging and are worth paying for.
Why Is Customer Retention Important?
One ProfitWell study found that customer retention is a better way to grow your business’s revenue than customer acquisition because retaining customers is cheaper than acquiring new ones.
Customer retention also boosts customer loyalty, which reaps the following benefits:
- Loyal customers often recommend products to their families and friends. The more customers you retain, the more customers you get.
- Loyal customers are more likely to provide helpful product feedback since they’re more invested in it.
- Loyal customers are likely to spend more with a company, which makes them more profitable for your business.
Types of Customer Retention Strategies
Companies must develop tailored customer retention strategies based on each customer lifecycle stage, as each has a direct impact on whether a customer churns, renews, or expands.
SaaS product operations and customer success teams should focus their retention efforts on three stages: New user onboarding, developing advanced users, and cultivating power users.
Let’s explore each in more depth:
New user onboarding phase
Users who have just signed up for your product need to find immediate value in your app so they have a reason to stick with it. That’s why you need to offer a great SaaS customer onboarding experience for new users and ensure they can easily find any product information they need.
In your new user onboarding experience, you need to:
- Guide users to their “aha!” moment.
- Reduce time-to-value.
- Provide in-app assistance to overcome technical-related setup and new user issues.
Developing advanced users
Users rarely or occasionally use your product need regular nudges to return to your app. These users are also most likely to abandon your product. You’ll also want to showcase to new users that your product can solve more than one challenge by showing the full potential of your product.
To develop new users into advanced users, you can:
- Provide in-app tutorials on advanced features.
- Send usage emails to your users to nudge them to utilize their subscriptions.
- Use pop-ups and emails to announce new features.
- Invite new users to connect with more advanced customers or to success story webinar.
- Monitor user actions that show intent for expansion opportunity.
Cultivating power customers
Power customers have developed into mature users of your product. They utilize its full breathe of features and solve multiple challenges. They are brand evangelists who publically speak on behalf of your product’s value.
To develop advanced users into power customers, you can:
- Collect their feedback to influence your product roadmap.
- Set up weekly 1-1 meetings to provide hands-on training and product tutorials.
- Invite customers to speak at your sponsored events or dinners.
- Invite customers to join private communities and roundtables to connect and learn with other power customers.
16 Must-Track Customer Retention KPIs and Metrics
Customer retention metrics serve as an essential check into your business’ health. These data points provide insights into how much revenue your business retains each month, whether it can survive its current churn rate, and how well your organization converts contract renewals.
Let’s explore 16 of the most important customer retention metrics to track, with examples, formulas, and how to improve each metric.
1. Customer churn rate
Customer churn rate is the percentage of customers who cancel their product subscription during a given period.
High churn rates indicate your product isn’t sticky or valuable enough for customers. Churn is also a barrier to business growth — no matter how many customers you acquire, a high churn rate means you’ll quickly lose most of them.
How to calculate customer churn rate
The formula for calculating customer churn is: (Number of churned customers during a given period / Number of total customers at the start of the time period) * 100
Let’s say you have 50 customers at the start of the month and 25 at the end of the month. This means your churn rate is 50%.
This is one of the simplest ways to calculate churn. However, your business may calculate churn differently depending on how you define a churned customer, the time period you consider, the seasonality of your business, and the difference in the behavior of different customer segments.
The average churn rate is highly dependent on industry and product type. For example, a mobile app has a much higher churn rate than a B2B software-as-a-service (SaaS) platform. However, a healthy churn rate is typically between 2% and 8%.
How to reduce customer churn rate
To reduce your churn rate, you need a solid customer retention strategy. Here are five steps to help you retain more customers and reduce churn:
- Improve your customer onboarding experience with in-app guidance such as product tours, walkthroughs, tooltips, and task lists.
- Monitor customer adoption with user behavioral analytics and data tracking.
- Continuously improve user proficiency with on-demand self-help and moment-of-need guidance.
- Create open communication channels with your customers and track call center metrics.
- Gather and incorporate customer feedback into your product roadmap.
2. Customer retention rate
Customer retention rate is the percentage of customers who continue paying for your product for a given period. Customer retention is also called logo retention or user retention.
A high customer retention rate indicates your business can grow revenue month over month because churn is less of an issue.
How to calculate customer retention rate
The formula for calculating customer retention is: (Total customers at the end of a time period – New customers acquired during that time period) / Existing customers at the start of the time period * 100
Let’s say you have 50 customers at the beginning of the month and 46 customers at the end of the month. Out of these, six are new customers you recently acquired. This means your business retained 40 customers in the month. Thus, your retention rate becomes 80%.
Software companies targeting enterprises must have a logo retention rate of 90%, while those targeting small and medium-sized businesses must retain at least 75% of their customers.
How to reduce customer retention rate
To improve your retention rate, you need a holistic strategy to enable customers and identify friction in the customer experience lifecycle. Here are a few examples:
- Enable new customers with product-led onboarding experiences using product tours and task lists.
- Provide interactive walkthroughs, tooltips, and in-app experiences to drive advanced feature adoption and drive awareness of product updates.
- Set up weekly 1-1 calls with customers.
- Provide self-service support options like knowledge bases and live chat.
3. Net MRR churn rate
Net monthly recurring revenue (MRR) churn rate is the percentage of revenue you lose in a month from cancellations and downgrades after considering revenue from existing customers through upgrades or expansions.
Net MRR churn rate tells you how much revenue you lose in a month after considering account expansion. Your net MRR churn also helps you understand if growth in your existing customer base is strong enough to offset losses from churn.
How to calculate net MRR churn rate
The formula for calculating MRR churn rate is: (MRR churn in a month – Expansion in the same month) / MRR at the start of the month * 100
Ideally, your net MRR churn rate should be zero or negative. If net MRR churn exceeds zero, you’re losing revenue faster than your existing customer base adds revenue.
How to reduce net MRR churn rate
To reduce your MRR churn rate, you need to understand the reasons behind it. With churn surveys, you can ask customers what made them cancel their subscriptions. This will help you identify the friction points so you can fix them before churn rates increase.
4. Gross MRR churn rate
Gross MRR churn rate is the percentage of revenue lost due to total cancellations or downgrades in a month. Gross MRR churn rate is usually greater than net MRR churn rate, as it doesn’t factor in expansion from existing customers.
Your gross MRR churn rate gives you an unfiltered view of monthly revenue loss.
How to calculate gross MRR churn rate
The formula for calculating gross MRR churn rate is: Total MRR churn in a month / Total MRR at the start of the month * 100
As per investor Alexander Bruehl, “If the Gross MRR Churn is above 1% to 2%, there seems to be an issue with the product or the ROI [return on investment] story.”
How to reduce gross MRR churn rate
Have a product development process in place to help identify reasons for churn. Churn surveys work well for many SaaS companies as they ask customers to choose the most significant reason they’re churning and the most minor reason. These are extremely powerful because they allow you to pinpoint your biggest areas of opportunity.
5. Net dollar retention rate
Net dollar retention rate, also called net revenue retention rate, is the opposite of net MRR churn rate. Net revenue retention rate is the percentage of recurring revenue retained from customers for a given period after factoring in upgrades, cancellations, downgrades, and pause requests.
Net dollar retention helps you gauge how well your business retains revenue from existing customers and how well your upselling and cross-selling strategies are working.
How to calculate net dollar retention rate
The formula for calculating net dollar retention rate is: (MRR at the start of a given period + upgrades during that period – downgrades – churn) / MRR at the start of a period * 100
Ideally, the net dollar retention rate should be greater than 100%, which means your business retains more revenue than it loses in a given month.
How to improve net dollar retention rate
To improve your net dollar retention rate, focus your resources on increasing account expansion through upsells and cross-sells and reducing churn. Some ways to get started may include:
- Prompt users to upgrade
- Use contextual in-app messages
- Use NPS surveys
- Provide an in-app customer help center
6. Gross revenue retention rate
Gross revenue retention rate measures the percentage of revenue retained over a given period without factoring in upgrades. Gross revenue retention is also called gross dollar retention or gross MRR retention.
Gross revenue retention tells you how well you can maintain existing revenue, even if none of your customers upgrade to higher plans. If gross revenue retention is low, churn and cancellations are eating into your monthly revenue, and you need to ramp up your retention efforts.
How to calculate gross revenue retention rate
The formula for calculating gross revenue retention rate is: (MRR at the start of a given period – downgrades – churn) / MRR at the start of a period * 100
If you start with $1,000 in a month and lose $300 due to churn and downgrades, you’re left with $700 in MRR in the end. So, your gross MRR retention rate is 70%.
If you don’t lose any recurring revenue in a month, your gross MRR retention will be 100%, which is the maximum value for this metric. The median gross revenue retention rate for SaaS is 80-90%.
How to improve gross revenue retention rate
You can influence your customers’ decisions to prevent them from canceling or downgrading their subscriptions or contracts.
Consider the following tips to improve your GRR:
- Improve the overall experience of your customers
- Build trust in your brand and your product
- Add more value to your product to make it more valuable to your customers
- Have an active customer success team
7. Customer lifetime value (CLTV)
Customer lifetime value (CLTV) represents the amount of money you expect customers to spend throughout their relationship with your business.
Your business may cater to wide-ranging customer segments, and lifetime value helps you gauge which customer groups are most profitable for your business and, thus, most worthy of your retention efforts.
How to calculate customer lifetime value (LTV)
The formula for calculating customer lifetime value is: Average revenue per account during a time period / Customer churn rate during the same time period
Since customer churn isn’t always linear and you may also experience expansions along the way, this is only a simplified formula that gives you a rough estimate of customer LTV.
How to improve customer lifetime value
A strong customer onboarding process helps increase customer lifetime value. Thorough onboarding allows customers to become more familiar with new features and relate them to their use cases.
To develop an engaging onboarding process, leverage onboarding UX components like checklists, user onboarding flows, and tooltips.
8. Expansion MRR rate
Expansion includes upsells, cross-sells, add-ons, and reactivation. Expansion MRR rate is the percentage of additional revenue you gain from existing customers for a given month.
High expansion MRR helps you offset losses from cancellations and downgrades.
How to calculate expansion MRR
The formula for calculating expansion MRR is: (Expansion MRR at the end of the month – Expansion MRR at the start of the month) / Expansion MRR at the beginning of the month * 100
Expansion MRR should ideally be greater than churn MRR for a given period to build a sustainable business.
How to improve expansion MRR
Upselling is a fundamental tactic behind increasing your expansion MRR. If you do it right, upselling can also increase your brand loyalty because customers who buy more already love your product.
9. Daily/Weekly/Monthly active users (DAU/WAU/MAU)
Daily active users (DAU), weekly active users (WAU), and monthly active users (MAU) are user engagement metrics that tell you how many customers use your product regularly. By keeping a pulse on DAU, MAU, and WAU, you can proactively monitor product usage, nudge inactive users to use your product more often, and prevent churn.
To calculate DAUs, MAUs, and WAUs, define what “active user” means for your SaaS business. For example, for a business chat app like Slack, an active user could mean someone who opens the app, clicks on unread chats, and sends messages.
Once you define active users for your product, calculate engagement metrics depending on how often your app should ideally be used.
For instance, for a social media app that could be used daily, DAU is an ideal measure of retention, while WAU is a perfect measure of stickiness for a grocery shopping app that may be used weekly. MAU is a good metric to track for an app with monthly usage, such as an employee payroll app
How to calculate DAU, WAU, MAU
- DAUs: Number of users who use your product daily
- WAUs: Number of users who use your product weekly
- MAUs: Number of users who use your product monthly
Use DAUs, WAUs, and MAUs to track retention trends for your business. If your active users decline from one month to the next, proactively help inactive users find value in your product to boost usage.
How to improve DAU, WAU, MAU
To improve your DAU, WAUs, and MAUs, focus on improving your product stickiness. You can do so by:
- Developing engaging user experiences
- Improving feature adoption rates
- Creating proactive upsell strategies and introducing existing users to more features
- Using customer satisfaction surveys to collect feedback, identify friction points, and improve feature offerings
10. Net promoter score (NPS)
Net promoter score is the percentage of customers likely to recommend your product (or promoters) minus the percentage of customers unlikely to recommend your product (detractors).
An NPS survey includes a single question, “How likely are you to recommend us to a friend?” Customers must choose from a scale of one to 10, where one means they’re unlikely to recommend a product, while ten indicates they’d be happy to recommend it.
A positive NPS score means your current customers are satisfied with their overall product experience and likely to become product advocates.
How to calculate NPS
You can calculate NPS with the following formula: % of promoters (customers who give you a score of 9 or 10) – % of detractors (customers who give you a score of 0 to 6)
For B2B software and SaaS companies, the average NPS is 30.
How to improve NPS
Add a qualitative question to the survey to improve your net promoter score and uncover users’ logic behind the score. This can help you identify why your customers might or might not promote your product.
Once you have these answers, follow up with the respondents by contacting them via email or inviting them for a call to learn more about their concerns.
11. Customer satisfaction score (CSAT)
Customer satisfaction score (CSAT) is the percentage of customers who are happy with your product or customer service experience.
CSAT surveys ask customers to rate a business on a scale of 1 to 5 based on the following question: “How satisfied were you with our product/service?”
Like NPS, CSAT is another metric that can be used to get a pulse on customer experience and gauge retention.
How to calculate customer satisfaction score (CSAT)
The formula for calculating CSAT is: Number of customers who rate your company 4 or 5 on a CSAT survey / Total number of customers who take the survey
The average CSAT for SaaS companies hovers around 76%.
How to improve customer satisfaction score (CSAT)
Customer satisfaction means meeting – and ideally exceeding – customer expectations throughout their entire customer journey. When you prioritize learning your customer’s needs, you can provide them with the best customer service possible.
Here are some ways to improve your customer satisfaction score:
- Be responsive
- Launch an omnichannel customer service strategy
- Train staff to understand your products and services
- Collect customer feedback
- Invest in self-service tools
12. Customer renewal rate
Customer renewal rate is a highly relevant customer success metric for SaaS businesses that follow a subscription-based model. It measures the percentage of customers who renew their subscription at the end of the subscription period.
A high customer renewal rate implies stable, recurring revenue from current customers. In turn, this allows you to focus more on acquiring new customers.
How to calculate customer renewal rate
The formula for calculating customer renewal rate is: Number of customers who renewed their contract / Number of customers up for renewal
How to improve customer renewal rate
To encourage repeat purchase frequency, consider offering incentives, discounts, and other small rewards to boost loyalty and turn them into loyal customers.
You can also use modals to improve your relationship with existing customers by greeting them, sending personalized messages, and giving them rewards.
13. Customer effort score (CES)
Customer effort score (CES) evaluates how easily customers can complete an intended action, such as buying a product, resolving a service issue, or acquiring information. This metric is important because when customers have to put in less effort to achieve their goals, it can lead to higher satisfaction and loyalty.
How to calculate customer effort score (CES)
The formula for calculating customer effort score is: Sum of all CES scores / Number of responses
How to improve customer effort score (CES)
To enhance your customer effort score, simplify customer interactions across your service or product offerings. This could mean streamlining processes to make them more intuitive, incorporating customer feedback to reduce effort, and expanding self-service options. Offering comprehensive FAQs and efficient chatbots can lower the effort required from customers, improving their overall experience and satisfaction.
14. Product adoption rate
Product adoption metrics like product and user adoption rates indicate the percentage of customers who start using a product after its acquisition. This metric helps businesses understand how well the target audience accepts the product and can indicate the effectiveness of onboarding processes.
How to calculate product adoption rate
The formula for calculating product adoption rate is:(Number of new users actively using the product / Total number of new users in the period) x 100%
How to improve product adoption rate
Improving product adoption rate can be done by developing a robust onboarding process that guides users through the product’s key features and benefits. Supplement this with educational content such as tutorials and webinars to help users get the most out of the product.
15. Repeat purchase rate
Repeat purchase rate (RPR) measures the percentage of customers who have made more than one purchase over a specific period. This metric is a key indicator of customer loyalty and the effectiveness of your retention strategies.
How to calculate repeat purchase rate
The formula for calculating repeat purchase rate is: (Number of customers who made more than one purchase / Total number of customers ) x 100%
How to improve repeat purchase rate
Implementing loyalty programs that reward customers for their continued business can be highly effective in improving repeat purchase rate. Tailoring marketing efforts through personalization based on customer preferences and purchase history ensures each communication feels relevant and valuable to the customer.
16. Customer health score
Customer health score is a composite metric used to gauge the overall health and potential long-term value of a customer relationship. It combines various indicators such as product usage, customer satisfaction, and engagement levels to predict customer loyalty and potential churn.
How to improve customer health score
Enhancing customer health score involves offering proactive customer support to anticipate and solve problems before they impact the customer. Engage customers regularly through well-thought-out programs or check-ins to maintain and increase their activity levels. Continual product improvements, driven by customer feedback and usage data, are vital to keep the score high, indicating healthy, satisfied, and engaged customers.
13 Customer Retention Strategies
Here are thirteen effective customer retention strategies for SaaS product operations and customer success teams to drive retention and account expansion:
1. Offer contextual, in-app guided onboarding for new customers and users
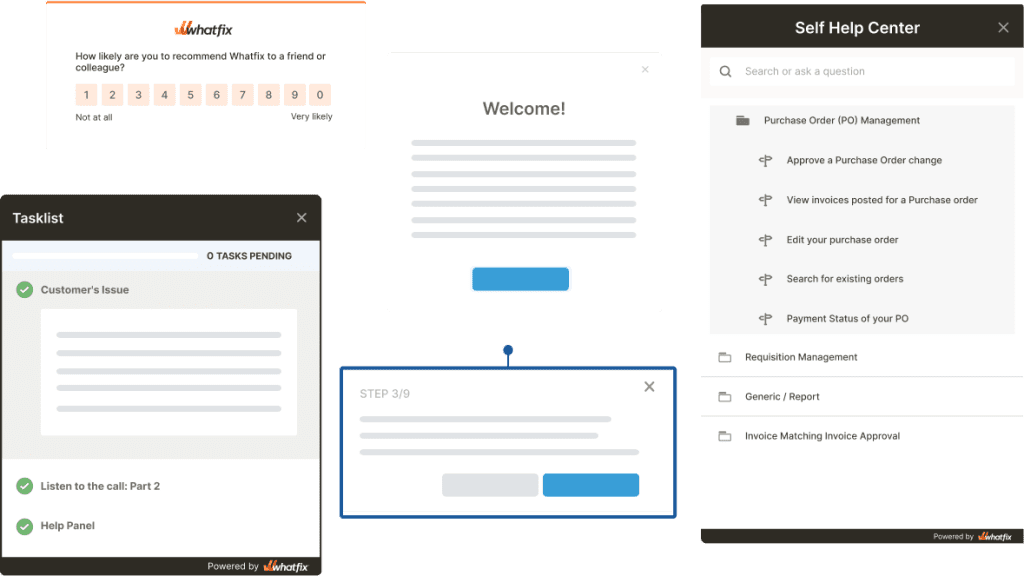
In-app onboarding allows products to create interactive, guided content such as step-by-step tutorials, product tours, interactive walkthroughs, tooltips, pop-ups, and more – all embedded within your app so users can learn how to use it in a practical, hands-on way.
In-app onboarding allows you to “show” customers how your app works while they use it, rather than tell them what to do via a lengthy demo or a knowledge base outside the app. Through real-time guidance, in-app onboarding makes it easier for customers to get value from your app and remain a customer.
In-app customer onboarding tools like Whatfix allow you to:
- Create and publish step-by-step instructions, task lists, tooltips, product tours, and walkthroughs to explain how to perform complex actions in your app and showcase its core features – all in a no-code, simple-to-use editor.
- Analyze and test your product experiences and user flows with advanced user behavior and product analytics.
- Collect customer and user feedback with native and embedded surveys, allowing you to understand customer sentiment, if your users find your onboarding helpful, and what new help content you need to create.
- Drive adoption of new features with beacons, tooltips, and feature walkthroughs.
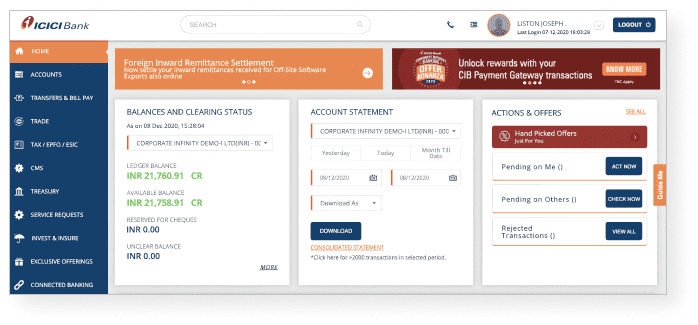
Take a look at how ICICI Bank uses Whatfix-powered in-app onboarding to educate customers about its corporate banking platform. Users who click on the Account Statement tab will see a walkthrough to complete the form fields and download their statements. The ICICI Bank app also included Smart Tips and task lists to take users through different activities within the app.
2. Use gamification to get customers to complete setup and onboarding
Gamification means adding game-like elements to your onboarding process, like rewarding customers when they complete a specific task in your app. Gamification is known to motivate users to complete routine tasks faster – rewards like badges and rankings on a leaderboard give a rush of dopamine.
Consider incorporating the following game-like elements to make your product onboarding more interesting:
- Let users choose an avatar when they sign up for your product
- Use progress bars to indicate how close users are to completing onboarding
- Offer a checklist of tasks users need to complete the unlock the next “level” in your product
- Provide perks for completing each step in the onboarding process
- Celebrate when users reach a particular milestone in product usage
- Give badges to users at different levels, such as beginner, intermediate user, and pro user.
Take a look at how LinkedIn motivates users to complete their profile:
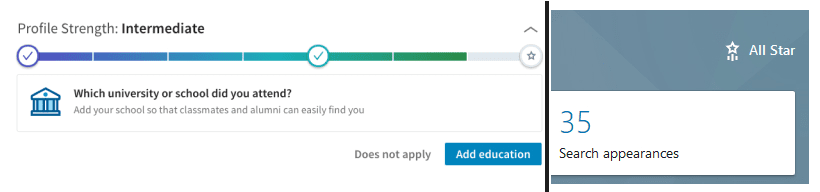
When users log in, they’re prompted to enter more information about their educational and career-related experiences so their profile can reach the coveted “All-Star” status.
3. Offer on-demand self-help options for customers
Self-help options allow customers to troubleshoot product problems on their own, without waiting in long customer service queues on the phone or another customer service channel. Interestingly, 81% of customers prefer solving problems on their own before contacting customer support for assistance, making customer self-help important.
You can add various self-help options to your website or app so customers can help themselves. These include:
- Self-help widgets in each section of your app.
- A knowledge base and/or help center with detailed how-to’s, tutorials, and troubleshooting docs.
- Chatbots that instantaneously respond to customer queries.
- A Frequently Asked Questions (FAQs) page.
With more customers preferring a self-service support model, adopting self-help options can be a huge driver in customer retention.
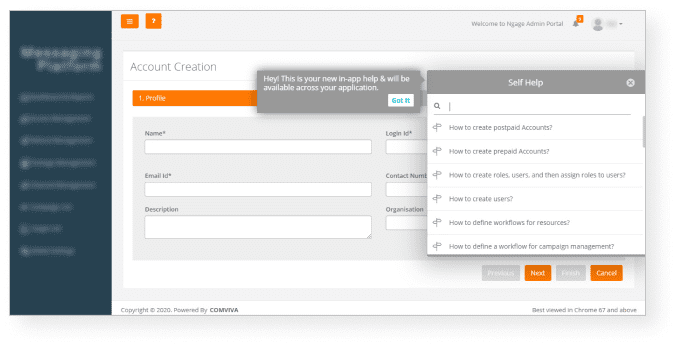
The Self-Help menu is contextual, which means it only displays information related to the section of the app a user is in and relevant to the user’s role (admin, manager, etc).
End-users are empowered to search the Self-Help menu for their unique issue, which is connected to a product’s knowledge base, support documentation, and more – which all prompt in-app tutorials that showcase step-by-step instructions to your customers.

Product managers, customer success teams, and more are empowered to capture behavioral data on how customers and end-users engage with their products, allowing them to make data-driven decisions to drive customer retention.
4. Ask customers for feedback
Customer feedback gives you insight into how each customer is (and isn’t) using your app. Using this knowledge, you can offer individual support to provide value to customers one at a time – helping to retain more customers.
New customer feedback also reveals insights that may boost your overall retention efforts.
For instance, if you consistently hear that onboarding is confusing, your product team can use that feedback to reassess the onboarding flow to make a more welcoming experience for new customers and increase retention. Or, if certain customers tell you your product isn’t a good fit for them, you could refine your marketing messages to attract the right kind of users likely to use your product longer.
Ask new customers for feedback at critical points in their product journey: after filling in their profile, completing an important app task, and being a customer for a certain period. Send in-app surveys so customers can respond when your product is top of mind. Tools such as Chameleon are good options for creating in-app surveys.
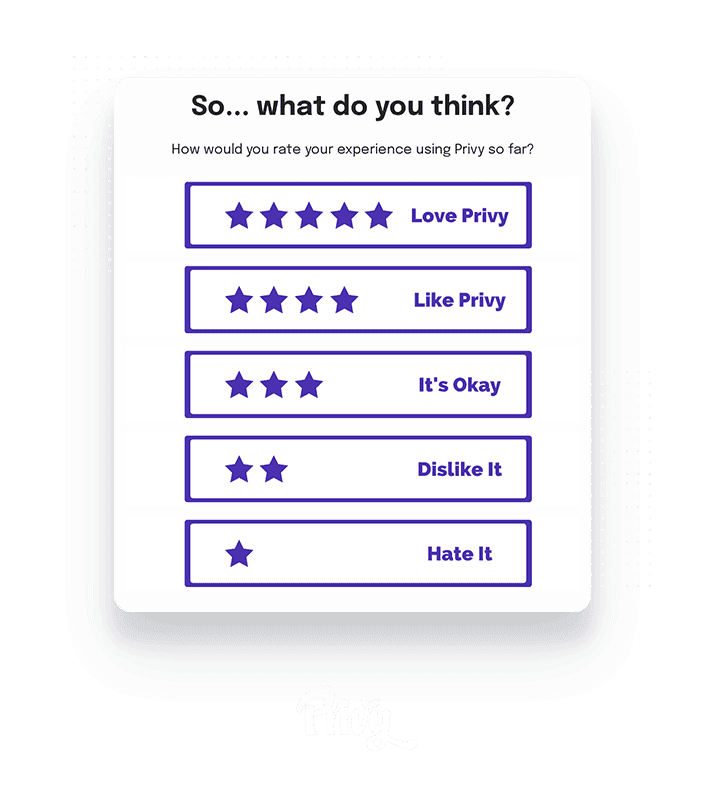
Take a look at this quick survey Privy uses to get new customer feedback on its product:
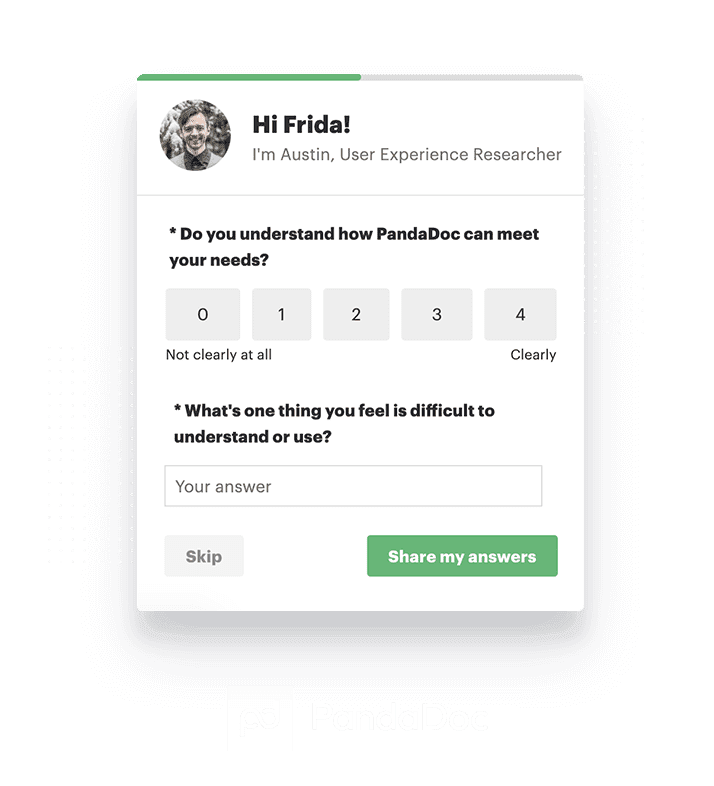
PandaDoc uses a similar survey, but it also asks users what they find difficult to do within the product so it can help the current customer and improve its onboarding process, too:
For new customers who don’t use your app frequently, send a quick note asking about their experience so far and how you can help them get more value out of your product.
With Whatfix’s digital adoption platform (DAP), product and customer-facing teams can collect customer feedback by creating in-app messages and surveys that prompt users with alerts to submit feedback directly inside the product. Whatfix’s customer feedback tools include detailed, free-response survey prompts like the following:

5. Send regular progress reports to your customers' end-users
Your app, product, or service may not always be top of mind for your customers, but their goals and pain points are. Sending updates reminds users of the important problems they want to solve and connects your product to something inherently valuable to your customers.
Email is an excellent channel for sharing progress reports with users. Progress reports usually list the most recent activities a user has performed within an app and any significant achievements they’ve made, like money saved or calories avoided. If different groups of people use your app, the report may also include updates on what other team members are up to within the app.
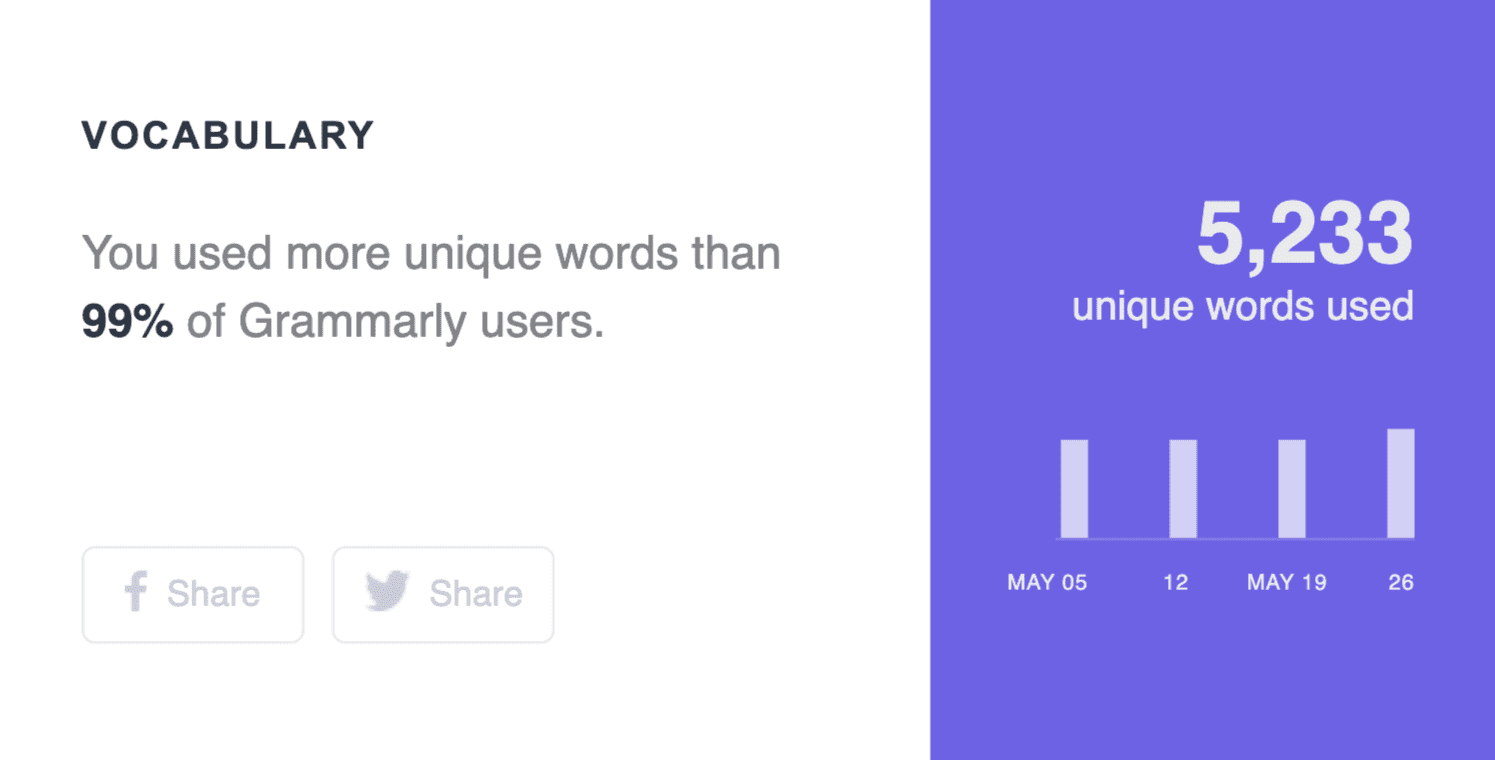
For instance, Grammarly sends a Weekly Writing Update email to users with insights about their writing: the volume of new words they used, how many words users wrote per week, and the top mistakes they made.
On the other hand, Tettra sends a daily digest email listing all new documents created and updated in the app and the total views received for pages in Tettra.
6. Use content to keep customers engaged
As Nir Eyal, author of “Hooked: How to Build Habit-Forming Products,” explains, content helps potential buyers habitually think about your product or service. If you regularly share helpful content with current and new customers, they will likely see your brand and product as trustworthy. You can also add calls to action within your content to drive readers back to your product.
To engage existing users, create content that helps them overcome challenges they face regularly and get better at their job. Tutorials, product guides, ideas for projects, and original research are good options for touching base regularly with existing customers.
Zapier is an excellent example of a SaaS product that harnesses content to engage customers. It publishes a ton of helpful guides on automating work with Zapier, as well as general guides on productivity and wellness.
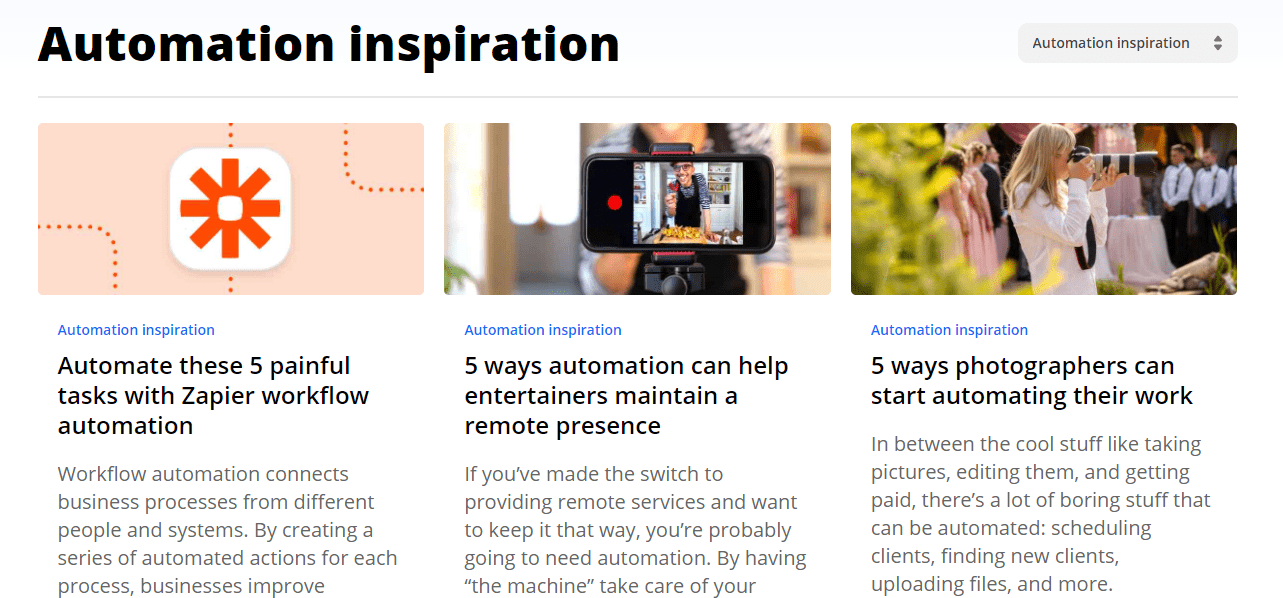
Within each piece of content is a quick call to action for users to try a given feature or process with Zapier, leading readers back to the product.
7. Identify red flags for signs of customer churn
The best way to prevent customer churn is to identify which customers are likely to churn and proactively reach out to win them back. Your most successful customers likely perform specific actions in your app within a certain period of time, which keeps them invested in your product. When customers don’t complete these critical actions in your product in a given time, it may be a red flag for churn.
To identify red flags for churn, first identify product usage patterns for your most successful customers, such as:
- How many sessions do they complete in your app in the first week or month?
- What key actions are they completing within your app within their first week or month?
- How often do they log in to your app in a given period?
Once you’ve identified usage patterns for regular users, use them as benchmarks to compare user activity for all customers. Product analytics tools such as Whatfix, Mixpanel, and Heap can help you track usage data for different customers.
GrooveHQ uses red flag metrics to identify which customers will likely churn and reach out to it. For instance, two of its red flag metrics are the frequency of logins and the length of the first session in the first 30 days. Users who leave after 30 days have short first sessions and log in less often. Thus, Groove’s customer success team keeps an eye out for these red flags and reaches out to at-risk users by email.
8. Offer add-ons and upsell discounts to power customers
Add-ons and discounts are a good way to show your appreciation for power users. Additionally, the more add-ons a customer opts for, the more they use your product, so it’s a win-win for both you and the customer.
Define what a power user means for your product: customers who use the most features, customers who make the most number of referrals, customers who are most active in support forums, or customers who are all of the above.
Once you’ve decided who qualifies as a power user, let these users try product add-ons for free for a limited period. You can also give them a discount on your subscription when they hit a milestone, like their first anniversary or making the most product referrals.
One of the well-known collaboration tools, Trello, offers a free month of Trello Gold to customers who invite the most users. This makes sense for Trello, as the best way to use the maximum of Trello’s collaboration features is to use it with other team members or collaborators.
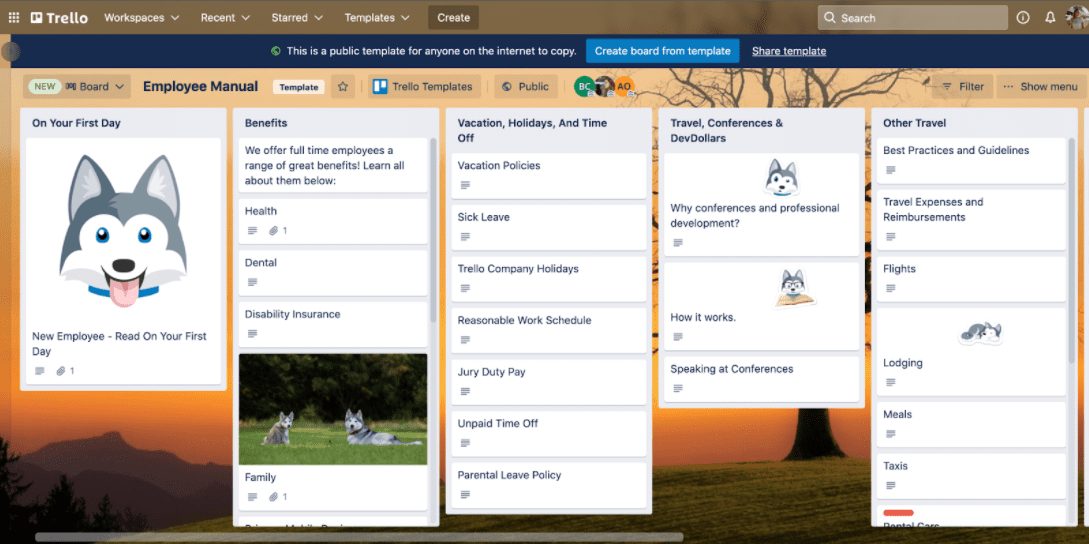
Trello Gold is an add-on pack that provides additional features for individual Trello users, like custom backgrounds, the ability to attach large files, and more Trello automations.
9. Give customers early access to new offerings
Giving power customers early access to new features has two main benefits:
- It gives you helpful feedback from someone who knows your product well.
- It makes power customers and users feel like they have a say in your product development roadmap.
As software developer Nick Bradbury points out, “power users want to be in control of the software they use.” Even if you ignore power users’ feedback, asking for their opinion can win you credibility and brownie points.
Create in-app surveys or emails asking power users if they’d like to beta-test new features and answer a few questions. If you run an online community or forum for users, post your request there, too. Tell users what the new tool or feature will help them accomplish and how they can contribute to its improvement.
See how Moz asks beta testers from its community of power users to try its new marketing tool.
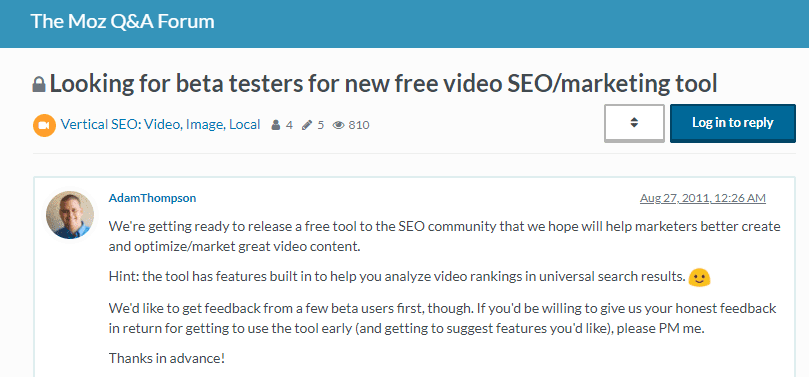
It emphasizes both early access and a chance to contribute to the product to get users excited about beta testing the new tool.
10. Cross-sell and upsell to power customers
When customers use a single product from a company, they could switch to a competitor if they want to since it’s easy to migrate information from a single app and learn a new tool.
On the other hand, if customers use multiple products or a wider range of product functionality, they may find it difficult to migrate data to different platforms, create multiple new accounts, and learn various new tools. As such, cross-selling and upselling increase the likelihood of power users becoming long-term customers.
To identify upselling and cross-selling opportunities, track power users’ activity inside your product. Check which features power users use most often and which additional features would make their job easier. If power users regularly use third-party integrations, see if any of your plans offer those integrations as a native feature. Use these insights to pitch relevant upsells and cross-sells to power users.
Don’t push upgrades or related products to power users every time they log into your app. Instead, ask power users to try advanced features for free for a limited period when they click on a premium feature within your app, or send them a periodic email reminding them about additional product functionality.
Power users may sometimes reach out to you asking for additional features and functionality, which is an excellent time to pitch higher-value subscriptions.
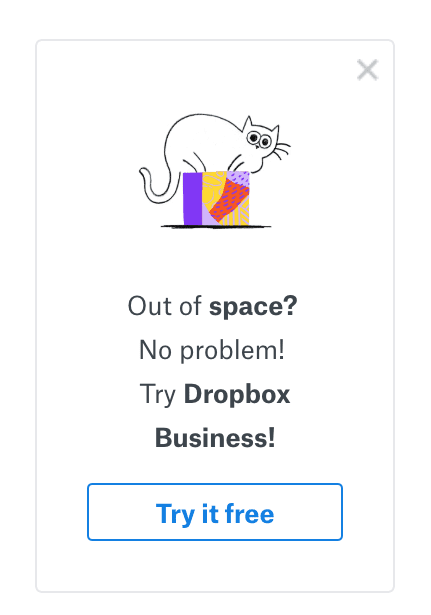
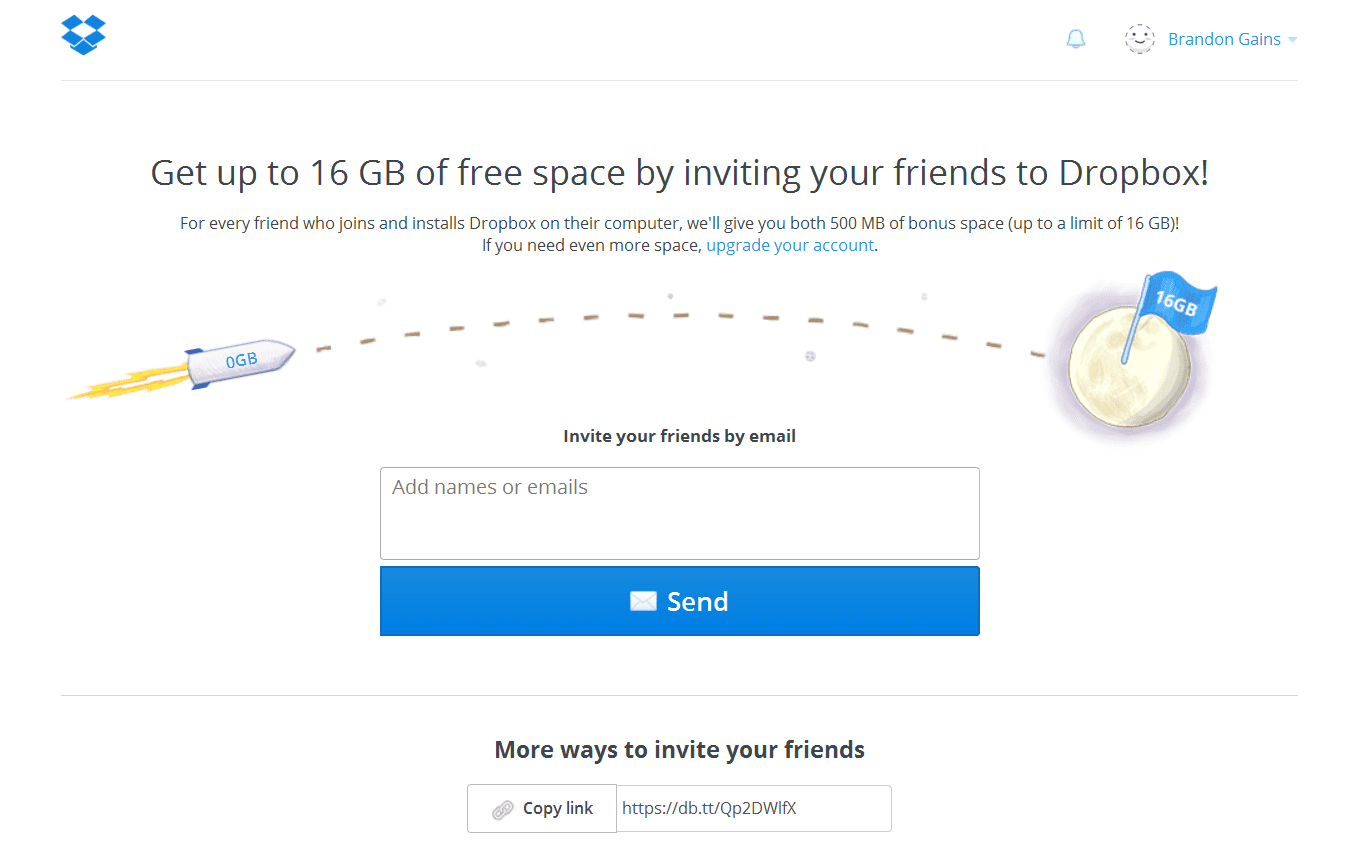
See how Dropbox prompts users to upgrade to a business account when users run out of space:
11. Build communities around your product
A product-focused community allows power users to share their experiences with other users, learn about features and benefits they may have missed, and help other users troubleshoot problems. In the process, communities help power users become more invested in your product and brand and make them more likely to stay with your brand.
Explore these ideas to build virtual and in-person communities around your product:
- Host virtual and in-person events and conferences
- Start a community newsletter
- Allow power users to host online and offline events
- Start an ambassador or referral program for your product
- Distribute product goodies and encourage users to share them on social media
For example, take a look at the different ways Notion builds and nurtures a community around its product:
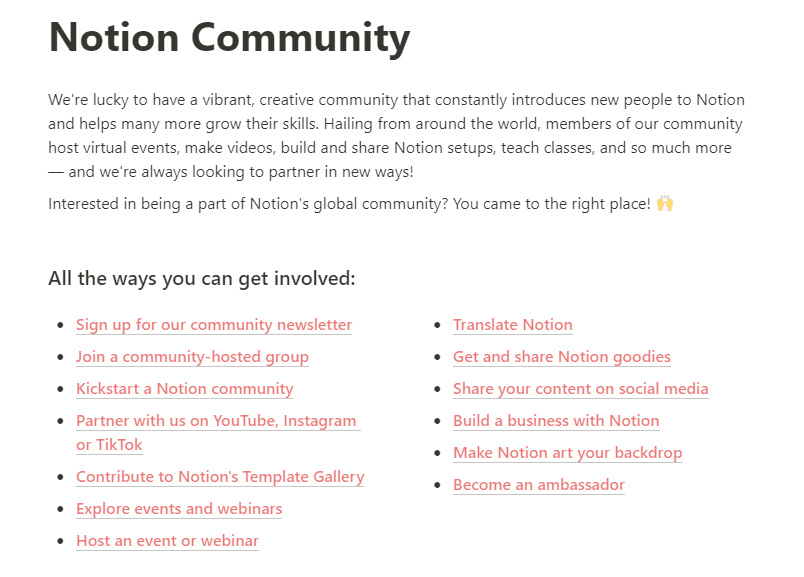
The tool allows users to create and share creative ways to use Notion, teach classes on using Notion, and run virtual events. Notion also promotes these events to its customers through its website and social media channels.
12. Invest in customer success management
Customer success has become synonymous with SaaS. Even from the first contact, it’s time to start offering a hands-on, detailed customer success experience that helps each user contextually meet their outcomes and goals or risk losing that connection when it’s time to renew.
It’s critical to continually prove to your customers that they made the right decision doing business with you. By proactively addressing customer needs and helping them achieve their goals, your company can improve customer satisfaction and reduce churn. Customer success managers can also identify opportunities for customers to expand their use of a company’s products and services, leading to increased revenue.
13. Offer referral programs
Referral plans can help to drive new customer acquisition by incentivizing existing customers to refer their friends and colleagues to your service. Since referrals tend to come from people who trust the referrer, the leads generated through a referral program are likely to be of higher quality than those generated through other marketing channel.
By incentivizing customers to refer their friends and colleagues, you can create a sense of loyalty and engagement among your existing customer base, which can help to improve retention. Referral marketing can also be a cost-effective way to acquire new customers, as it relies on existing customers to spread the word about your service.
One example of a SaaS company with a great referral program is Dropbox. Dropbox’s referral program rewards users with additional storage space for every new user they refer to the service. This incentivizes current users to share Dropbox with their friends and colleagues, and also rewards them for doing so by providing them with additional value in the form of increased storage capacity. The program is also simple and easy to use, allowing users to easily refer others by sharing a unique referral link.
Whatfix provide product ops and customer success teams with an all-in-one SaaS guidance and retention platform to analyze, build, and deliver engaging experiences that drive adoption and account expansions.
With Whatfix, you can:
- Create segmented user onboarding experiences that guide users to experience their “aha!” moment on their first visit with in-app Task Lists and Tours.
- Drive adoption of advanced and new features with Flows and Smart Tips.
- Use Pop-Ups to announce product updates, upcoming webinars, new customer training resources, or showcase upsell CTAs to customers who have taken actions that signal they may be interested.
- Enable users with an in-app resource center (Self Help) that connects your knowledge base, customer training resources, help desk, and more into a searchable, intelligent self-help technical support center.
- Use Analytics to identify areas of friction, build segmented user cohorts to target with in-app messages, optimize your user journeys, and improve onboarding completion rates.
- Collect user feedback like NPS, feature requests, bug reporting, and more with in-app Surveys.

Request a demo to see how Whatfix empowers organizations to improve end-user adoption and provide on-demand customer support


Thank you for subscribing!